
Understanding Data
Study Understanding Data in Class 12 Computer Science, with detailed explanations, worked examples, NCERT solutions and practice questions.
By Akhilesh Saini
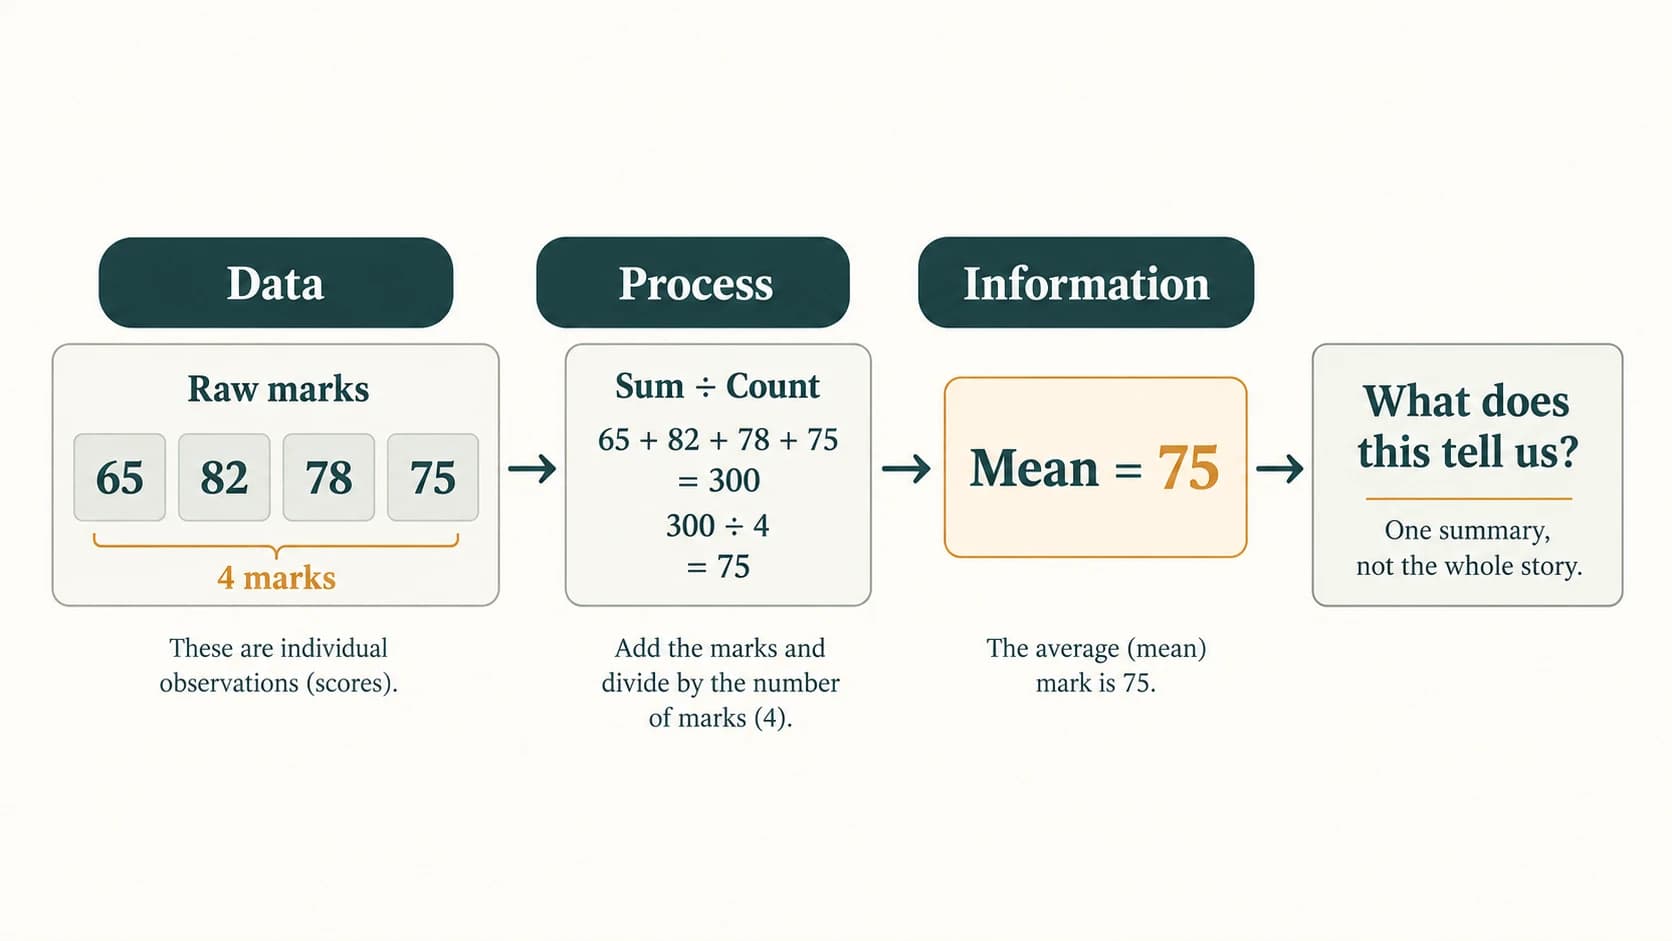
Data help us make decisions, but an unorganised collection of numbers or messages does not automatically supply a good answer. We need to decide which data to collect, how to organise them, how to process them and how to interpret the results. This chapter follows NCERT's progression from data types and data storage to the five introductory statistical techniques used for summarisation.
Source coverage. The supplied NCERT Class XII Computer Science Chapter 7, Understanding Data, printed pages 97–110, includes one explicitly numbered activity (7.1), five worked statistical examples (7.1–7.5), nine numbered end-of-chapter exercises, and an additional unnumbered canteen-analysis question after Exercise 9. Every question and subpart is solved below in original explanatory language. In-text questions and the textbook's six-scenario statistical-method selection table also receive responses. This chapter includes original Python illustrations and extra practice; these are not falsely labelled NCERT programs.
Curriculum note. The uploaded permanent Class XII master curriculum does not allocate specific lesson IDs for Understanding Data. Thus C12-CH07-S01 through C12-CH07-S07 are stable chapter-section anchors, not fabricated C12-DB-*, C12-PY-* or other curriculum lesson IDs.
Learning objectives
After reading this chapter, you should be able to explain the difference between data and information; identify structured and unstructured data and metadata; select appropriate collection and storage methods; describe a processing cycle and common data-quality checks; compute mean, median, mode, range and population standard deviation; recognise the effects of outliers; and justify a statistical method for specific school, banking and canteen scenarios.
Reading map
| Section | Main lesson | NCERT coverage | Skills |
|---|---|---|---|
C12-CH07-S01 | Data and information | §7.1; §7.1.1 | Identify data and decisions |
C12-CH07-S02 | Structured and unstructured data | §7.1.2 | Fields, records, metadata |
C12-CH07-S03 | Data collection and quality | §7.2 | Sources, recording, validation |
C12-CH07-S04 | Data storage and retrieval | §7.3 | Files, media, DBMS |
C12-CH07-S05 | Processing data into information | §7.4; Figures 7.1–7.2 | Input, processing, output |
C12-CH07-S06 | Mean, median and mode | §7.5.1; Examples 7.1–7.3 | Central tendency |
C12-CH07-S07 | Range, standard deviation and decisions | §7.5.2; Examples 7.4–7.5 | Variation and interpretation |
Section C12-CH07-S01 — Data, Information and Decisions
1. What is data?
Data are recorded facts, values, observations or symbols. Examples include marks, dates, images, bank transactions, messages, weather measurements and readings from sensors. Data may be numbers, text, sound, pictures or other digital representations. One observation is often called a datum, though modern English commonly treats “data” as either singular or plural depending on context.
Information is data organised or processed to answer a question. For example:
| Raw data | Processing question | Information made useful for a decision |
|---|---|---|
65, 82, 78, 75 | What is the mean score? | Mean is 75, useful for a class summary |
| Four daily transaction amounts | What is total spending? | A total by date and category |
| Hourly temperatures | Was the week variable? | Mean and range, with units |
| Student placement records | What fraction got placed? | A documented placement rate with denominator |
A result can be mathematically correct but misleading if the observations are incomplete or biased. If 18 of 20 respondents like a service, we may say 90% of these 20 respondents liked it, but not that 90% of the whole city does without a valid sampling design.
2. Why collect data?
NCERT uses examples from college selection, population census, sports strategies, banking, shopping, transport and weather forecasts. Each shows the same underlying idea: the relevant observation must exist before it can be evaluated.
- College choice: compare fees, placements, faculty, facilities and the definitions behind published placement statistics.
- Banking: keep account and transaction records so balances can be updated when funds are withdrawn or deposited.
- Weather: assemble measured conditions and satellite observations to support forecasts.
- School administration: retain attendance, performance and other authorised records to serve students and parents.
- Commerce: analyse purchases or sales to decide stock levels and pricing; conclusions should be drawn from observed, not assumed, customer behaviour.
The responsible question is not “How much data can we collect?” but “Which information is necessary for the stated purpose?” Collecting unnecessary personal data adds risk and does not necessarily improve a decision.
3. Reading units and definitions
Always record what a number means. A field called balance could mean rupees, dollars, a closing balance on one date or the average balance across a month. Accurate analysis requires the measure, unit, time period, source and method.
| Field | Example value | Necessary context |
|---|---|---|
| Temperature | 34 | °C; day and observation time |
| Marks | 82 | Marks out of 100; test and subject |
| Sale price | 25 | ₹ per 200 mL pack; product identity |
| Monthly average balance | 18000 | ₹; averaging method and month |
Worked checkpoint: For scores = [65, 82, 78, 75], the sum is 300 and mean is 300/4 = 75. A mean alone does not say whether scores are clustered near 75 or vary widely.
Section C12-CH07-S02 — Structured Data, Unstructured Data and Metadata
1. Structured data
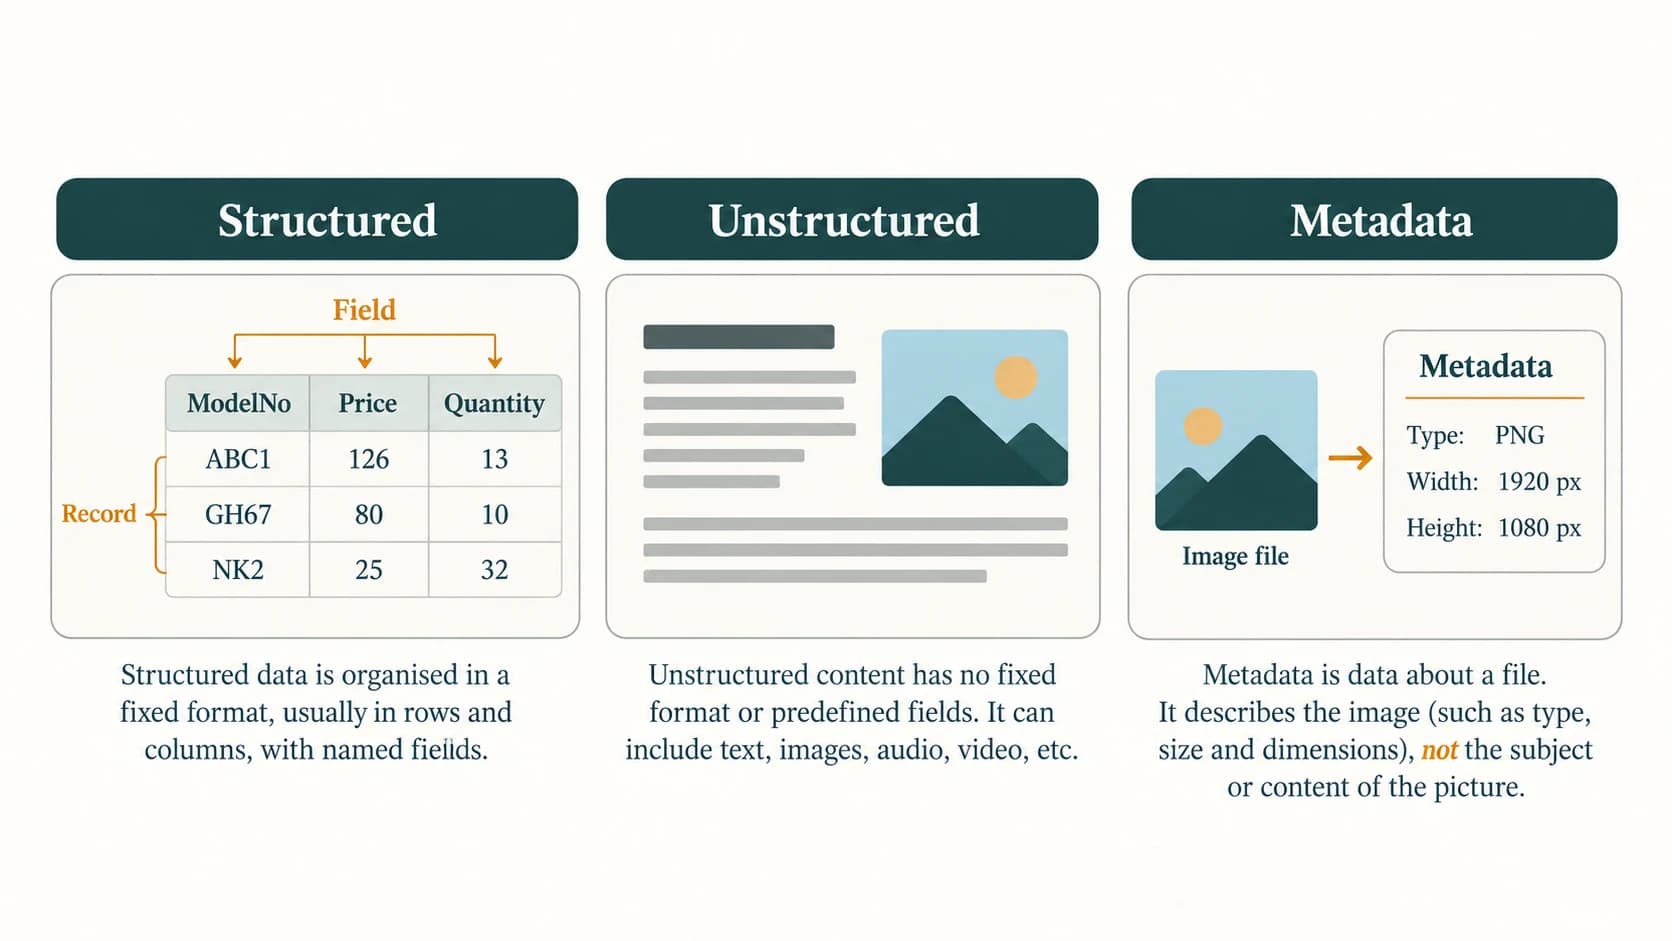
Structured data follow a defined arrangement, commonly a table of rows (records) and columns (attributes/fields). NCERT Table 7.1 gives a kitchen-item inventory with fields ModelNo, ProductName, Unit Price, Discount(%) and Items_in_Inventory. Each row describes one product. Here is the textbook dataset for analysis:
| ModelNo | ProductName | Unit Price (₹) | Discount (%) | Items in inventory |
|---|---|---|---|---|
| ABC1 | Water bottle | 126 | 8 | 13 |
| ABC2 | Melamine Plates | 320 | 5 | 45 |
| ABC3 | Dinner Set | 4200 | 10 | 8 |
| GH67 | Jug | 80 | 0 | 10 |
| GH78 | Table Spoon | 120 | 5 | 14 |
| GH81 | Bucket | 190 | 12 | 6 |
| NK2 | Kitchen Towel | 25 | 0 | 32 |
The total physical units are 13 + 45 + 8 + 10 + 14 + 6 + 32 = 128. The total undiscounted stock value is ₹54,058, calculated as the sum of unit_price × quantity across rows. Discounts are deliberately not applied because this particular stock-value calculation uses listed unit prices, as NCERT describes.
A record or row refers to an observation, while an attribute or column describes a type of value. Examples from NCERT Table 7.2 include book titles/authors/prices, school-fee receipts and ATM withdrawal details.
2. Unstructured data
Unstructured data do not follow one fixed row-and-column arrangement for their content. Examples include natural-language essays, audio recordings, videos, image collections, web pages and open-ended social posts. A photo does not become a structured table simply because it is stored as a file; its content may still require interpretation. Modern systems can extract structured features from unstructured material, but that is an additional processing step.
| Structured example | Unstructured counterpart |
|---|---|
| Roll-number, date and present/absent columns | Free-form teacher diary paragraph |
| Product ID, price and quantity table | Product demonstration video |
| Ticket transaction row | Customer's unrestricted written complaint |
| Filename and image dimensions stored as fields | The image pixels themselves |
Important nuance: One object can contain both kinds of data. An email has structured headers such as sender, recipient and time, but its body and attachments may be unstructured.
3. Metadata is data about data
Metadata describe another item. A digital photograph may have width, height, file type, size or capture time. An email may have a subject, sender, recipient, timestamp and attachment filenames.
Metadata may also be sensitive. Location tags in a photograph, for example, can reveal where it was captured. Not every camera file necessarily includes every metadata field, and some fields may be edited or removed.
4. Labels that must not be confused
- Categorical data: labels like class division, colour or item type (the lesson’s original extension).
- Numerical data: observations such as temperature, marks and price.
- Structured vs unstructured: describes organisation/format, not whether values are numeric or categorical.
- Metadata: describes the observation or file, not necessarily its underlying content.
A table of text labels can be perfectly structured. Conversely, a photograph consists of numerical pixels yet is not treated as a conventional tabular dataset in NCERT's classification.
Section C12-CH07-S03 — Data Collection, Sources and Quality
1. Three collection situations from NCERT §7.2
The grocery-sales example distinguishes three realistic starting conditions.
| Starting condition | First practical step | Typical destination |
|---|---|---|
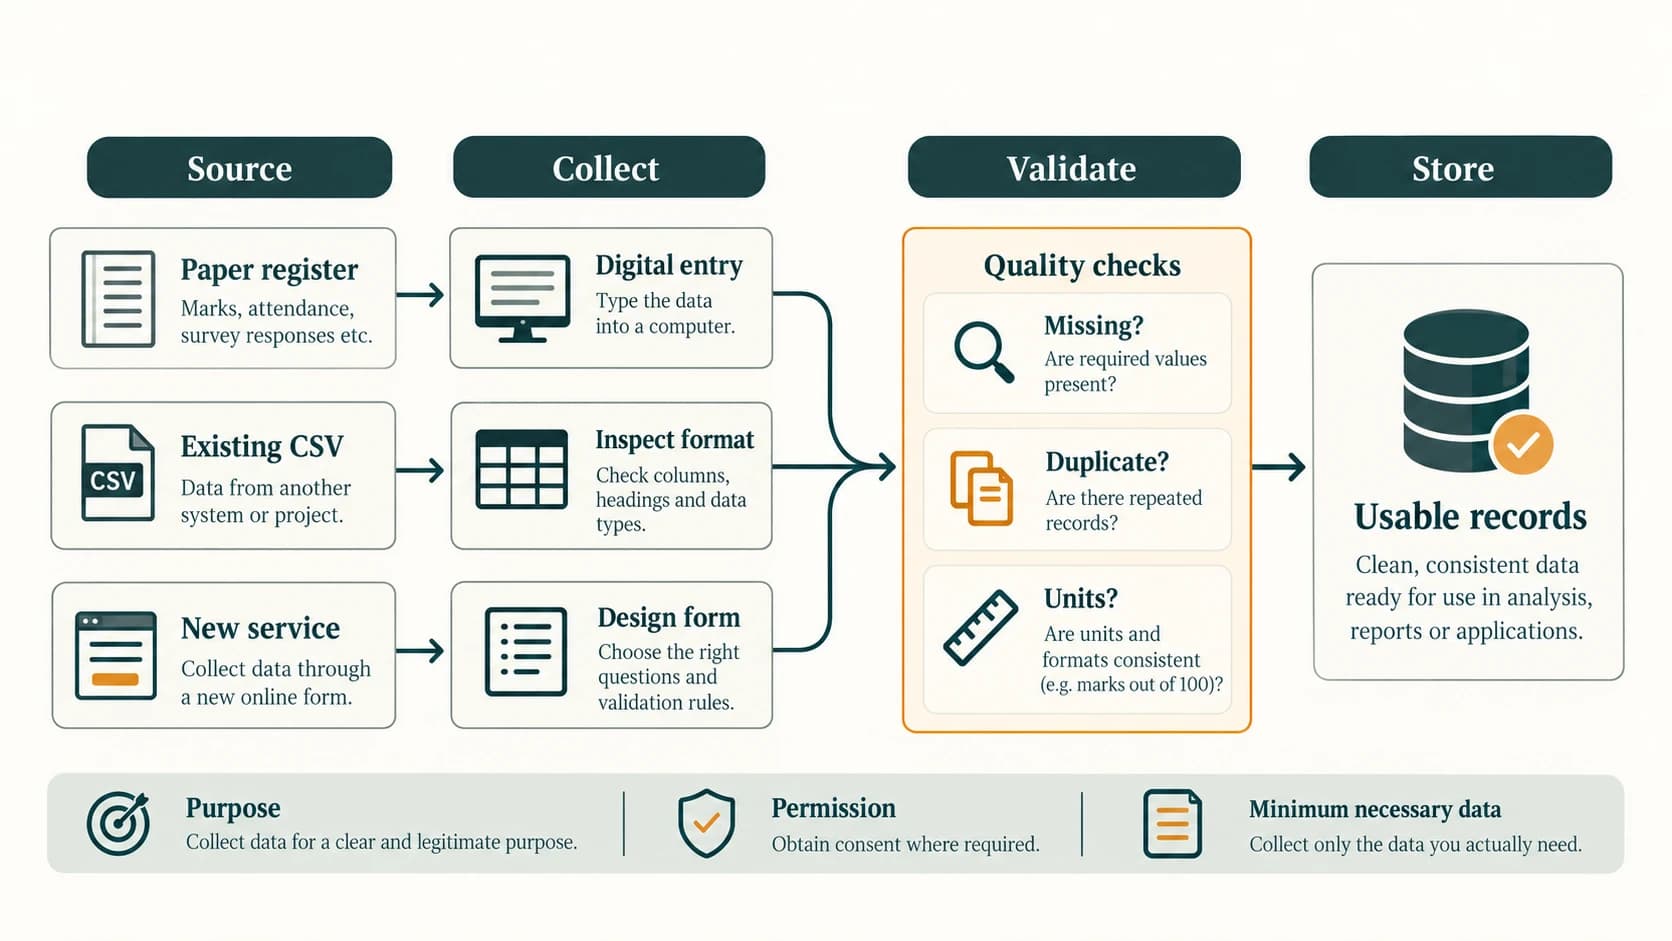
| Paper register or diary | Transcribe carefully; check duplicates and dates | Spreadsheet or CSV |
| Digital records already available | Inspect schema, delimiter, units and missing values | CSV-processing program or database |
| No records yet | Decide necessary fields, build a recording process | New data-entry form, file or database |
Direct collection may include a survey, interview, observation, measurement or assessment. Existing records may include a register, transaction log or consented historical dataset. A source must be relevant to the question; collecting more rows cannot repair a fundamentally biased collection method.
2. A practical data-collection plan
- Define the purpose, e.g. “compare average unit-test marks for July to November.”
- Specify observations and units: student, month, score, maximum marks and absent-status policy.
- Identify a legitimate source and whether permission is required.
- Record observations in a consistent schema, preferably with stable identifiers.
- Check missing entries, duplicate records, implausible values, inconsistent units and date formats.
- Store responsibly; limit access and retention of personal data.
- Document any exclusions or corrections before analysis.
Example: scholarship eligibility. Suppose the rule is more than 75% in each of two consecutive years, plus documented annual family income less than ₹5 lakh. The conditions use strict comparisons >75 and <500000; a score of exactly 75% or income exactly ₹5,00,000 does not satisfy the stated rule. Real eligibility decisions should use the published scheme's precise rules rather than inferred criteria.
3. Privacy and fair use
Collect the minimum personal information necessary for the task, handle sensitive records securely, verify lawful access and do not print real PINs, bank credentials or biometric templates into practice datasets. For classroom demonstrations, synthetic or fictional data are preferable. Avoid publishing identifiable individual scholarship or account balances when aggregated results suffice.
4. Short Python validation example (original extension)
records = [
    {"student_id": "S101", "july_marks": 82, "max_marks": 100},
    {"student_id": "S102", "july_marks": 77, "max_marks": 100},
]

for row in records:
    if not 0 <= row["july_marks"] <= row["max_marks"]:
        raise ValueError("Marks outside the expected range")
    print(row["student_id"], row["july_marks"])
This checks only one kind of validity. A value of 80 may still belong to the wrong student or year even when it lies within the allowed range.
Section C12-CH07-S04 — Data Storage and Retrieval
1. Why store data?
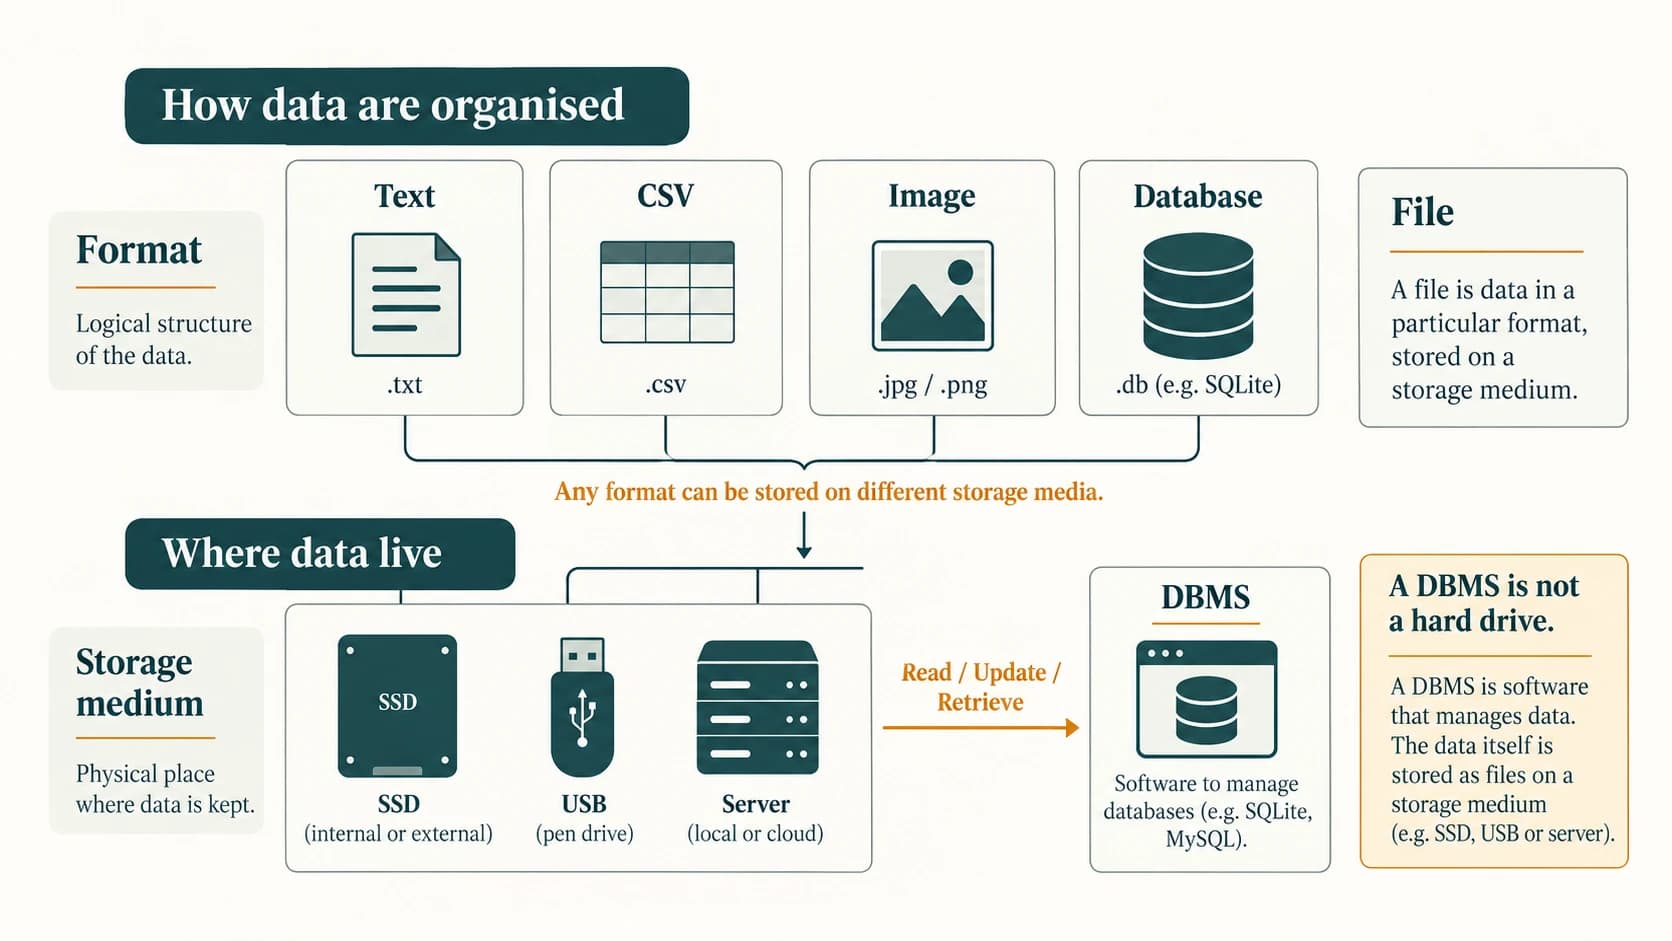
Storage allows data to be retrieved, checked, updated and compared later. NCERT lists devices such as hard disk drives, solid-state drives, optical discs, tape drives, pen drives and memory cards. A device is not the same as a logical file format. The same CSV file could reside on an SSD, USB storage or a server.
2. Files and databases
| Storage approach | Suitable use | Main consideration |
|---|---|---|
Plain text (.txt) | Simple notes or logs | May lack a consistent schema |
| CSV | Row-and-column data | Handle quoting, missing fields and types carefully |
| Images/audio/video | Multimedia | Often unstructured; metadata can assist indexing |
| DBMS | Large related record collections | Queries, controlled updates, consistency and access policies |
A DBMS can address many limitations of manually coordinated files, including inconsistent updates and difficulties searching linked records. It does not automatically guarantee perfect security or eliminate the need for backups and careful database design.
3. Does processing always require saving a file first?
No. Small values can be read, processed and shown immediately in memory. Saving becomes important when information must survive program termination, be audited, be shared or be analysed later. A stream of sensor readings can be processed as it arrives and optionally archived.
measurements = [18, 20, 21]
mean_reading = sum(measurements) / len(measurements)
print(mean_reading)  # 19.666666666666668
# The result was computed without first writing a file.
Good practice includes backups, appropriate access restrictions and recording data provenance when results may later be challenged.
Section C12-CH07-S05 — Processing Data into Information
1. Data processing cycle
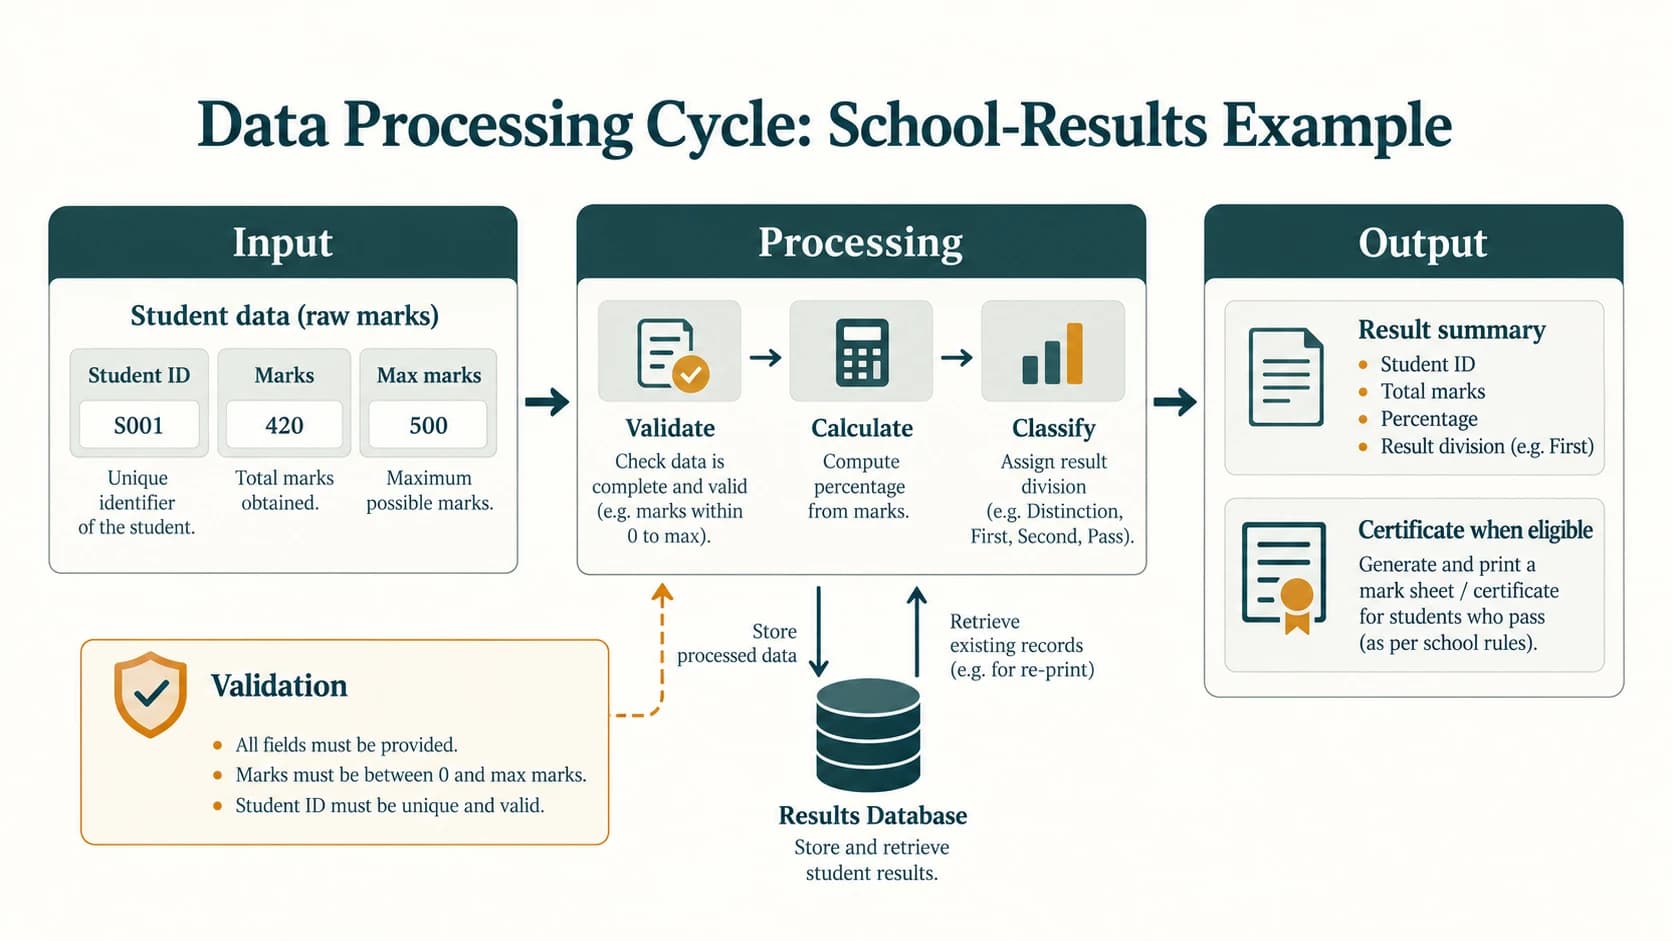
NCERT Figure 7.1 describes input → processing → output, with activities such as collection, preparation, entry, storage, retrieval, classification and updating. The purpose is to turn recorded values into understandable results such as tables, reports or summaries.
| Stage | Student-results example | ATM-withdrawal example |
|---|---|---|
| Inputs | Student identity, scores, maximum marks | Card/account identifiers, requested amount |
| Checks | Match student, verify marks and absence status | Authenticate securely, check balance and applicable limits |
| Processing | Compute totals, percentages or class summaries | Authorise and record deduction; dispense notes if successful |
| Output | Result, grade summary, authorised certificate | Dispensed cash and transaction record/receipt |
Security clarification: An ATM PIN is a credential, not a field to expose in student records or audit reports. Real systems must also handle atomicity, failed cash dispensing and reversals. These implementation concerns are additional to the simplified NCERT illustration.
2. Three NCERT Figure 7.2 case studies
Online examination form and admit card: Input candidate details and a photograph/signature; check registration, eligibility and payment; output authorised examination details and a roll/admit-card record.
Bank ATM withdrawal: Receive a withdrawal request; securely verify identity, permissions and available funds; authorise and execute transaction; output cash and receipt on a successful transaction.
Railway-ticket issue: Collect itinerary, passenger count, class and preferences; check availability and payment; output ticket/berth details or an appropriate waiting-list status according to the actual reservation system.
3. One question, different computations
Given the seven product inventory records in NCERT Table 7.1, a shop owner may ask for different outputs:
items = [
    {"name": "Water bottle", "price": 126, "quantity": 13},
    {"name": "Melamine Plates", "price": 320, "quantity": 45},
    {"name": "Dinner Set", "price": 4200, "quantity": 8},
    {"name": "Jug", "price": 80, "quantity": 10},
    {"name": "Table Spoon", "price": 120, "quantity": 14},
    {"name": "Bucket", "price": 190, "quantity": 6},
    {"name": "Kitchen Towel", "price": 25, "quantity": 32},
]
print(sum(row["quantity"] for row in items))
print(sum(row["price"] * row["quantity"] for row in items))
# 128
# 54058
Neither result alone is a decision. Stock quantities might inform reordering, while the listed-price total informs inventory valuation under the assumed method.
Section C12-CH07-S06 — Mean, Median and Mode
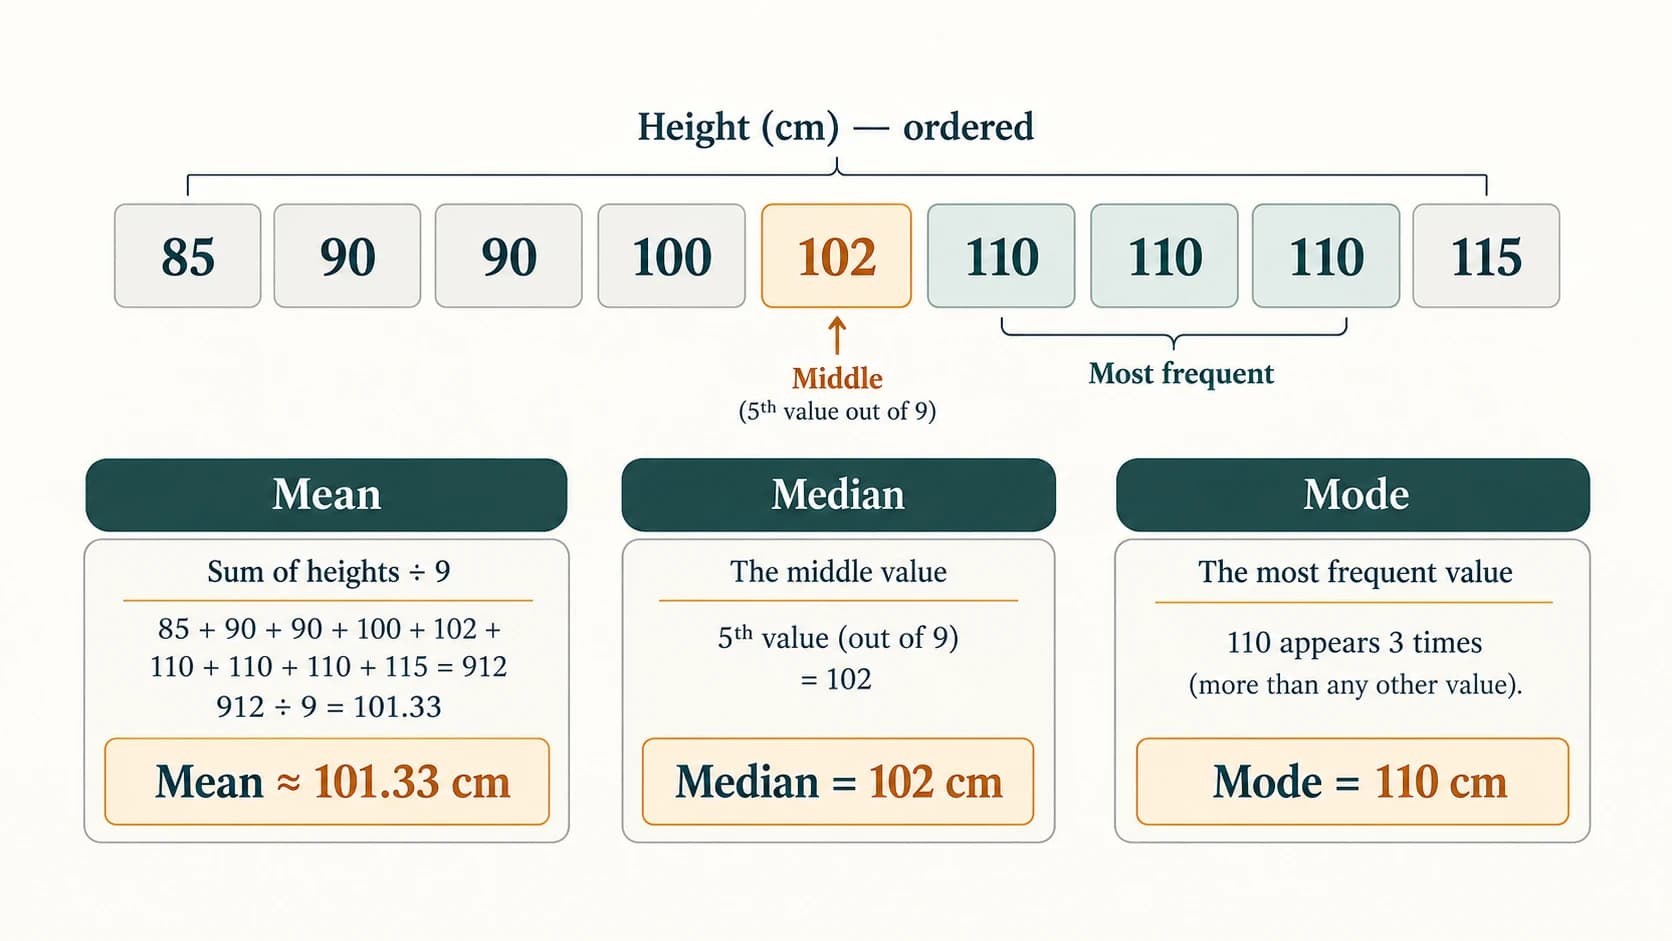
These are the three measures of central tendency in NCERT §7.5.1. They answer different questions and are not always interchangeable.
1. Mean (arithmetic average) — Example 7.1
For numeric values , the arithmetic mean is
NCERT's nine student-height observations (cm) are:
[90, 102, 110, 115, 85, 90, 100, 110, 110]
Sum = 912 cm, count = 9, so mean = 912/9 = 101.33 cm (rounded to two decimal places). Every observation contributes to the mean. It is sensitive to extreme values.
Important teaching clarification: NCERT warns that outliers can distort a mean and often treats them as errors. However, not every outlier is erroneous. First investigate an extreme value; only correct or exclude it for a defensible documented reason. Removing genuine unusually high or low data merely to make a mean look better is inappropriate.
2. Median — Example 7.2
Order the heights:
[85, 90, 90, 100, 102, 110, 110, 110, 115]
Nine values are present, so the middle is at index 4 (fifth position). Median = 102 cm.
- If
nis odd, take the middle ordered value at indexn//2. - If
nis even, average the two middle ordered values at indicesn//2 - 1andn//2.
For [10, 20, 30, 40], the median is (20+30)/2 = 25, not 20 or 30 alone.
3. Mode — Example 7.3
The mode is the most frequently occurring value. In the NCERT heights, 110 cm appears three times, more than any other height, so the mode is 110 cm.
A dataset can be bimodal or multimodal if several values tie for the highest repeated frequency. If all values occur exactly once, this textbook uses the convention “no mode”; some software would still report tied values, so always state the intended convention. Mode works for categories too, e.g. most common car colour.
4. One height dataset: three different summaries
| Measure | NCERT height result | Interpretation |
|---|---|---|
| Mean | 101.33 cm | Arithmetic average |
| Median | 102 cm | Middle ordered observation |
| Mode | 110 cm | Most frequent observation |
None of these alone measures how far the values spread. For dispersion, use the next lesson.
5. Python implementation (independent original example)
from statistics import mean, median, multimode

heights = [90, 102, 110, 115, 85, 90, 100, 110, 110]
print(round(mean(heights), 2))    # 101.33
print(median(heights))            # 102
print(multimode(heights))         # [110]
For an empty list, these calculations are undefined without a special policy. Validate the input rather than silently dividing by zero.
Section C12-CH07-S07 — Range, Standard Deviation and Interpretation
1. Range — Example 7.4
Range = maximum − minimum. For NCERT's heights, 115 − 85 = 30 cm. Range is easy to compute but uses only the two extreme observations and therefore can change sharply if just one extreme changes.
2. Population standard deviation — Example 7.5
The standard deviation (SD) describes how widely values are distributed around their mean. NCERT uses the population formula, which divides by n:
For the nine heights, the exact squared-deviation sum is 938 cm². Hence:
| Stage | Computation | Result |
|---|---|---|
| Count | n | 9 |
| Mean | 912 ÷ 9 | 101.333… cm |
| Sum of squared deviations | Σ(x − mean)² | 938 cm² |
| Population variance | 938 ÷ 9 | 104.222… cm² |
| Population SD | √104.222… | 10.21 cm |
The NCERT calculation table describes these values as heights; its table caption mistakenly refers to “attendance.” Its rounded individual deviations may sum to a tiny nonzero number; the exact deviations sum to zero. Keep full precision until the final rounding step.
Population vs sample: The textbook uses n because it treats the given dataset as the complete group being described. Statistical estimation from a sample often uses n−1, giving a different sample standard deviation. Do not interchange the two without saying which is required.
from statistics import pstdev, stdev

heights = [90, 102, 110, 115, 85, 90, 100, 110, 110]
print(round(pstdev(heights), 2))  # 10.21: population SD (NCERT)
print(round(stdev(heights), 2))   # sample SD, a different definition
3. Same mean does not imply the same variability
| Dataset | Mean | Range | Population SD |
|---|---|---|---|
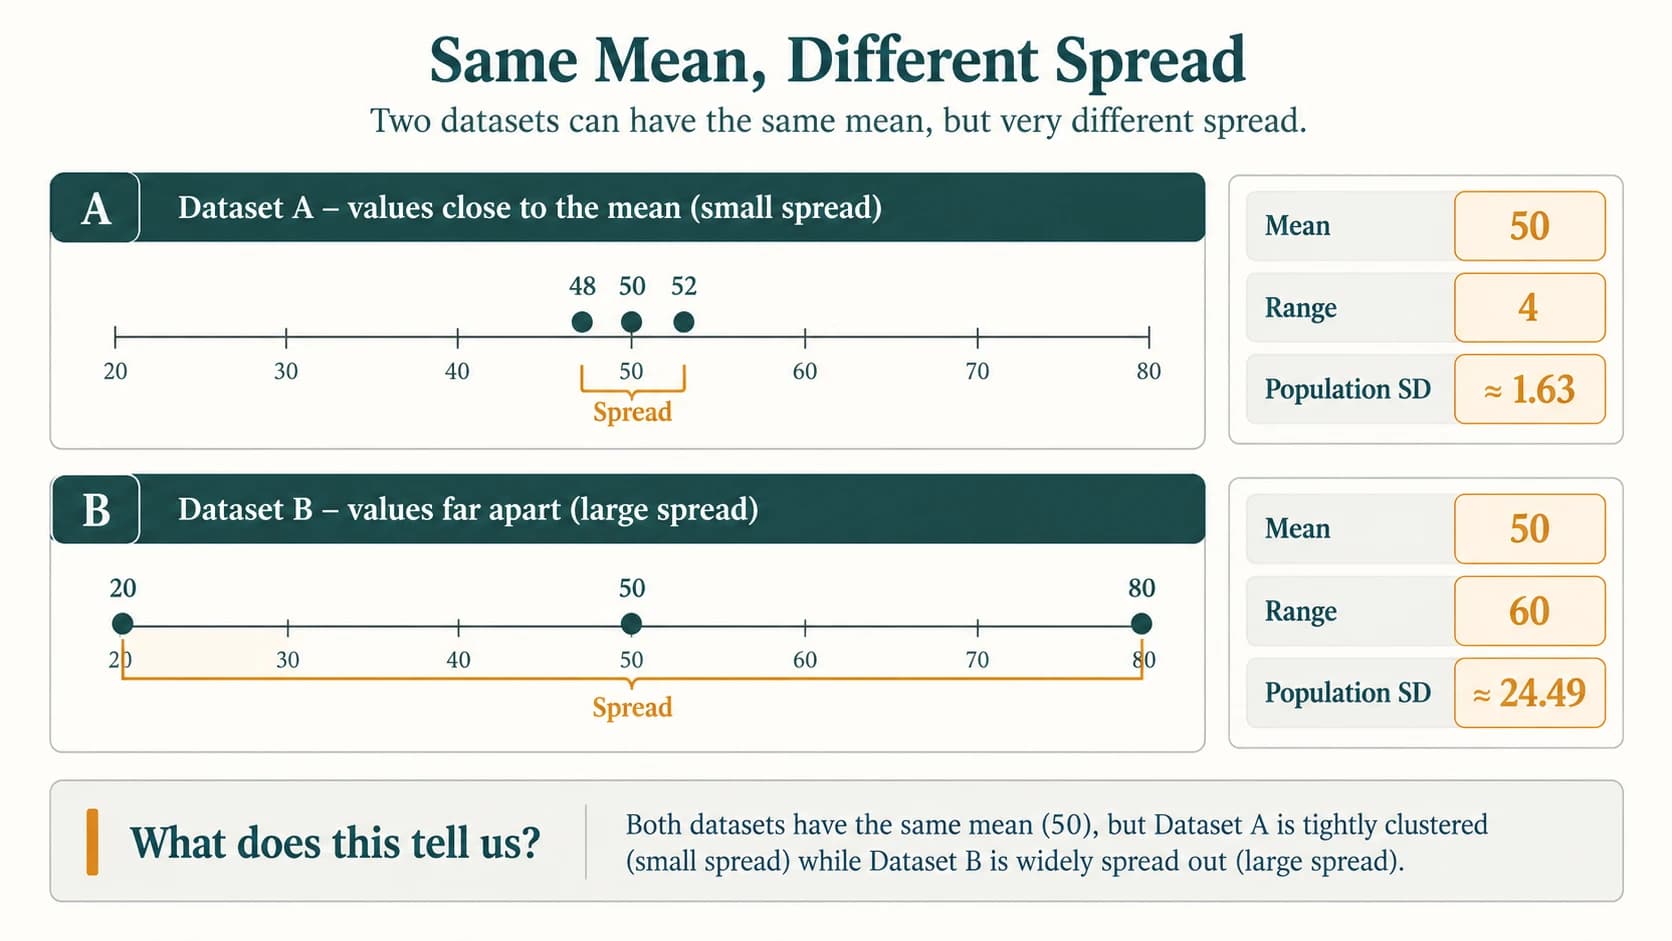
A = [48, 50, 52] | 50 | 4 | ≈ 1.63 |
B = [20, 50, 80] | 50 | 60 | ≈ 24.49 |
Both sets average to 50, but B has a much wider spread. This is why NCERT presents measures of central tendency and measures of variability separately.
4. Seven-day temperature exercise preview
NCERT Exercise 5 supplies 34, 34, 27, 28, 27, 34, 34 °C.
| Requested output | Appropriate method | Worked result |
|---|---|---|
| Average daily temperature | Mean | 218/7 = 31.14 °C |
| Weekly temperature spread | Range | 34 − 27 = 7 °C |
| Day-to-day dispersion | Population SD | ≈ 3.31 °C |
from statistics import mean, pstdev

temperatures = [34, 34, 27, 28, 27, 34, 34]
print(round(mean(temperatures), 2))                  # 31.14
print(max(temperatures) - min(temperatures))         # 7
print(round(pstdev(temperatures), 2))                # 3.31
5. Choosing a method
| Question being asked | A good starting method | Reason |
|---|---|---|
| Typical arithmetic level | Mean | Uses all numeric observations |
| Middle value with high or low extremes | Median | Less affected by outliers |
| Most common category or value | Mode | Counts frequency |
| Highest-minus-lowest spread | Range | Simple extreme difference |
| Overall spread around mean | Standard deviation | Uses all numeric values |
These are tools for summarisation, not automatic proofs of why a pattern exists. A useful report states units, sample size, source and any meaningful limitations.
NCERT Activity 7.1 and In-Chapter Questions — Solved
Activity 7.1 — Identify structured fields on voter identity cards
NCERT task: Observe voter identity cards for family members and identify the fields. Are the fields the same on all cards?
Answer: Examples of field types include the elector's name, identifying number, photo, age/date-of-birth information, gender, relative's name, address or assembly-constituency details, and issuing authority. A card's exact printed fields, layout and language can vary by issue date and format; do not claim that every card always has identical visible fields. The data are structured because the issuing process assigns named fields to an elector's record.
For a classroom answer, students should record only field names, not copy or publish real family members' identifying numbers, addresses or photographs. A safe example is Field: Elector name — Type: Text; Field: Elector ID — Type: Identifier.
In-text prompt A — Attributes needed for an Aadhaar enrolment record
A data model might need a record identifier, the person's name, date of birth/age information, gender, address, consent/enrolment information and required identity-verification fields. Do not create real Aadhaar identifiers or collect actual biometric samples for a class activity. Specific official data requirements vary by enrolment/update procedure; the point of the textbook question is to identify the concept of attributes and their formats.
In-text prompt B — Can a photograph have metadata?
Yes. Possible metadata include dimensions, file format, file size, capture date/time, camera model and geolocation. Some fields are optional or unavailable, and metadata can be removed or altered. Such properties describe the photo; they are not the same as recognising people or objects in the image itself.
In-text prompt C — Must data be stored in files before processing?
No. Values can be received and processed in memory. Saving to a file or database is helpful when persistence, audit, later retrieval or sharing is needed. A live reading can be processed immediately and later saved according to an authorised policy.
In-text prompt D — Which is more sensitive to outliers, mean or median?
The mean is generally more sensitive because a very large or small observation contributes directly to its sum. Example: [10, 11, 12] has mean and median 11. Replacing 12 by 120 changes the mean to 47, while the median stays 11. Investigate outliers rather than automatically deleting genuine extreme values.
In-text statistical-method table — Six situations
NCERT's table asks students to select suitable methods from mean, median, mode, range and standard deviation. The following are reasoned selections; context may justify combining more than one.
| Textbook situation | Primary technique | Why this technique works |
|---|---|---|
| Disparity in salaries of employees | Standard deviation | Measures the overall spread of salaries; median may also describe typical pay |
| Teacher wants average performance of an entire class | Mean | Direct arithmetic average of marks |
| Compare heights of residents of two cities | Mean and standard deviation | Mean compares levels, SD compares variation (use both if comparison is broad) |
| Find a dominant value in a dataset | Mode | Finds the most frequent value |
| Compare income of residents of two cities | Median (and SD if analysing inequality) | Median is useful when very high incomes skew the mean |
| Most popular car colour in a city survey | Mode | Colours are categories, not suitable for numerical averaging |
For marks or salaries from unequal groups, also show group sizes and explain whether observations are comparable.
NCERT Chapter 7 — Complete Exercise Solutions (Questions 1–9)
NCERT Exercise 1 — Data fields for four digital services
Task: Identify the data required for these services. The suggested schemas are illustrative rather than a claim that every real organisation stores exactly these fields.
(a) Declare exam results and print e-certificates
| Field type | Example fields | Why needed |
|---|---|---|
| Identity | Student ID, name, school, class, roll number | Match results to students |
| Examination | Board/exam code, subject, year/session | Identify the correct exam |
| Assessment | Subject marks, maximum marks, qualifying criteria | Compute result accurately |
| Certificate issue | Certificate ID, issue date, verification reference | Issue/verifiable document |
Processing: Verify score completeness and identity, apply approved pass/grade rules, and produce the result or e-certificate. Avoid unnecessarily publishing individual records.
(b) Register exhibition participants and issue biometric ID cards
Use participant ID, full name, organisation/school, category or role, permitted contact details, registration status, event access level and card validity. If the event truly requires biometrics, an authorised capture/verification process and appropriate consent/security controls are also necessary; do not suggest saving raw biometric data casually in a CSV or printed report. Generate a unique card identifier and authorised access information.
(c) Search for an image using a search engine
Potentially relevant data include the uploaded/query image (or descriptive search words), indexed image identifiers, image size/type, a source address, permitted content descriptors or features, and relevance-ranking signals. Processing: extract or compare relevant query features and return candidate images with source information. A search engine does not need to know a person's private identity merely to retrieve public images.
(d) Book an OPD appointment in a specified hospital department
Minimum useful attributes may include appointment ID, patient registration reference, selected department, date/time, doctor/clinic availability, booking status and a contact method for confirmation. Verify capacity and return an appointment confirmation. Patient-related information is sensitive; a classroom schema should use fictional records.
NCERT Exercise 2 — Merit-cum-means scholarship for 500 students
Task: Prepare eligible beneficiaries who scored more than 75% in two consecutive years and whose annual family income is less than ₹5 lakh.
Required fields: Student ID, both academic years, marks and maximum marks for each year (or verified percentages), annual family income and documentary verification status. For a school of 500 students, include only relevant enrolled candidates and protect the individual income details.
Solution workflow:
- Collect the two-year academic records and permitted, verified family-income information.
- Match records by stable student ID; check both years are consecutive, and handle transfers/missing records according to approved rules.
- Calculate each year's percentage as
marks_obtained / maximum_marks × 100, unless a validated percentage is supplied. - Check strict conditions:
year1 > 75,year2 > 75, andincome < 500000. - Output the list of qualifying student IDs with a verification status; have school authorities review the result before any real award.
# Fictitious demonstration records only.
students = [
    {"id": "S01", "year1": 78, "year2": 82, "income": 420000},
    {"id": "S02", "year1": 75, "year2": 91, "income": 300000},
    {"id": "S03", "year1": 81, "year2": 79, "income": 500000},
    {"id": "S04", "year1": 80, "year2": 77, "income": 350000},
]
eligible = [
    record["id"] for record in students
    if record["year1"] > 75
    and record["year2"] > 75
    and record["income"] < 500000
]
print(eligible)  # ['S01', 'S04']
Boundary point: “More than 75%” is not the same as “75% or more,” and “less than five lakh” excludes exactly ₹5 lakh. The dataset does not contain the school’s real 500 records, so the actual beneficiary count cannot be determined from the question alone.
NCERT Exercise 3 — Survey the popularity of Bank XYZ in City ABC
Task: Outline how to collect data about the number of accounts held by each family and the average monthly account balance of each person, and what results can be checked.
Data design: Use a family survey ID, respondent consent status, household size, number of accounts with XYZ and other banks (with clear definitions), anonymous person codes where needed, and voluntarily reported or appropriately authorised average monthly account balances. State whether balance means a month's daily average, month-end amount or another definition.
Collection and processing steps:
- Define the target population: residents/families of City ABC and a specified survey period.
- Choose a representative sampling method; do not rely only on existing XYZ customers.
- Use a consistent questionnaire and lawful, voluntary access to financial information.
- Check missing/duplicate households, clarify account ownership and avoid counting joint accounts inconsistently.
- Aggregate survey results without exposing confidential personal balances.
Possible outputs: number/share of sampled families holding at least one XYZ account; average number of accounts per household; distribution of XYZ versus competitor accounts; average or median balance by bank (if valid comparable data exist); comparison by locality or household-size group when sample sizes permit. This describes how to study popularity, not a proven ranking of the bank: the question supplies no actual survey observations or bank-balances data.
NCERT Exercise 4 — Classify four data-generation situations
| Situation | Main content type | Explanation |
|---|---|---|
| (a) Recording a video | Unstructured | Video frames/audio have no single conventional row-and-column content structure; file metadata may be structured |
| (b) Teacher marking attendance | Structured | Each student, date and present/absent value can be stored as fields |
| (c) Writing tweets/social posts | Primarily unstructured content | The message text/images are flexible; account ID/time metadata are structured |
| (d) Filling an online application form | Structured | Input is organised into named fields with expected formats |
Nuance: A video is digital data and may contain structured metadata; classifying its content as unstructured does not deny that fact.
NCERT Exercise 5 — Seven-day temperatures and appropriate statistics
Given (°C): 34, 34, 27, 28, 27, 34, 34.
(a) Average temperature
Choose the mean. Sum = 218; number of days = 7:
(b) Temperature range
Choose the range: maximum − minimum = 34 − 27 = 7 °C.
(c) Standard deviation of temperature
Choose population standard deviation if these seven days are the complete week being described. The exact sum of squared deviations is 538/7 ≈ 76.8571 °C²; dividing by 7 gives variance 538/49 ≈ 10.9796 °C². Therefore:
from statistics import mean, pstdev
week = [34, 34, 27, 28, 27, 34, 34]
print(round(mean(week), 2))        # 31.14
print(max(week) - min(week))      # 7
print(round(pstdev(week), 2))     # 3.31
The two rounded measures describe different things: mean is the level, while standard deviation describes variation around that level.
NCERT Exercise 6 — Compare Class XII divisions and month-by-month tests
(a) Compare divisions in Class XII A and XII B, each with equal strength
Because a division (First, Second, Third, etc., as defined by school policy) is a category, a frequency table or percentage distribution by division is the clearest comparison. Among NCERT's five named summary statistics, mode indicates the most common division within each class. If both classes have equal strength, the counts in each category can also be compared directly. Merely averaging labels “First” and “Second” is not meaningful.
Illustrative only: If Class A has 25 First-division pupils and Class B has 18 First-division pupils, A has more pupils in that category, assuming identical class size, examination and grading rules. These are not numbers provided by NCERT.
(b) Compare one class across July–November unit tests
Use the mean mark or mean percentage for each month's test so the teacher can compare overall class performance. If different tests have different maximum marks, standardise to percentages before comparing. Optionally include standard deviation to show whether performance is becoming more or less consistent. The exercise provides no monthly marks, so actual means cannot be calculated.
NCERT Exercise 7 — Alumni parents and age variability
(a) Number of students whose both parents are school alumni
The task is to count records meeting two Boolean conditions. The primary technique is a frequency/count, not mean, median, mode, range or standard deviation applied to raw names. Encode parent_1_alumnus and parent_2_alumnus as yes/no fields and count students for whom both are true.
families = [
    (True, True),
    (True, False),
    (False, True),
    (True, True),
]
print(sum(a and b for a, b in families))  # 2
The question supplies no real parent records, so the school's actual count is unknown. Count students rather than parents to avoid double-counting the same student's two alumni parents.
(b) How varied are the parents' ages?
Use range for a quick maximum-minus-minimum measure and standard deviation if the question asks about the spread of all observed ages. Ages must be collected with consent and measured consistently. Without the age list, no numerical answer can be produced.
NCERT Exercise 8 — Choosing an annual-day anchor among 42 students
(a) How to collect the singing, writing and monitoring skills?
Use direct assessment/observation, such as a short audition for singing, a comparable writing exercise and a group-coordination task scored by an agreed rubric. A self-report survey may support the process, but observed performance is more suitable for a selection decision. Apply the same tasks and scoring criteria to all 42 students to make the process fair.
(b) How to represent those skills as data?
Use a structured score sheet with a row per student and separate numerical scores for each skill, alongside an ID and the agreed scoring rubric.
| Student ID (fictional) | Singing /10 | Writing /10 | Monitoring /10 | Total /30 |
|---|---|---|---|---|
| S01 | 8 | 7 | 9 | 24 |
| S02 | 7 | 9 | 8 | 24 |
| S03 | 9 | 6 | 8 | 23 |
If different skills should carry different weights, decide those weights before evaluating students. A tie may require a second assessment; a three-score total is not an automatically fair or complete judgment of a person's abilities. No real class data are provided in the textbook.
NCERT Exercise 9 — Structured versus unstructured data
Structured data have a pre-defined field arrangement, such as a school attendance table with student_id, date and present columns. Unstructured data lack one fixed tabular arrangement, such as the free-form text and attachments of an email message. Data can be converted or annotated: an email may contain structured header metadata even if its body is unstructured.
NCERT Unnumbered Task After Exercise 9 — School Canteen Data Analysis
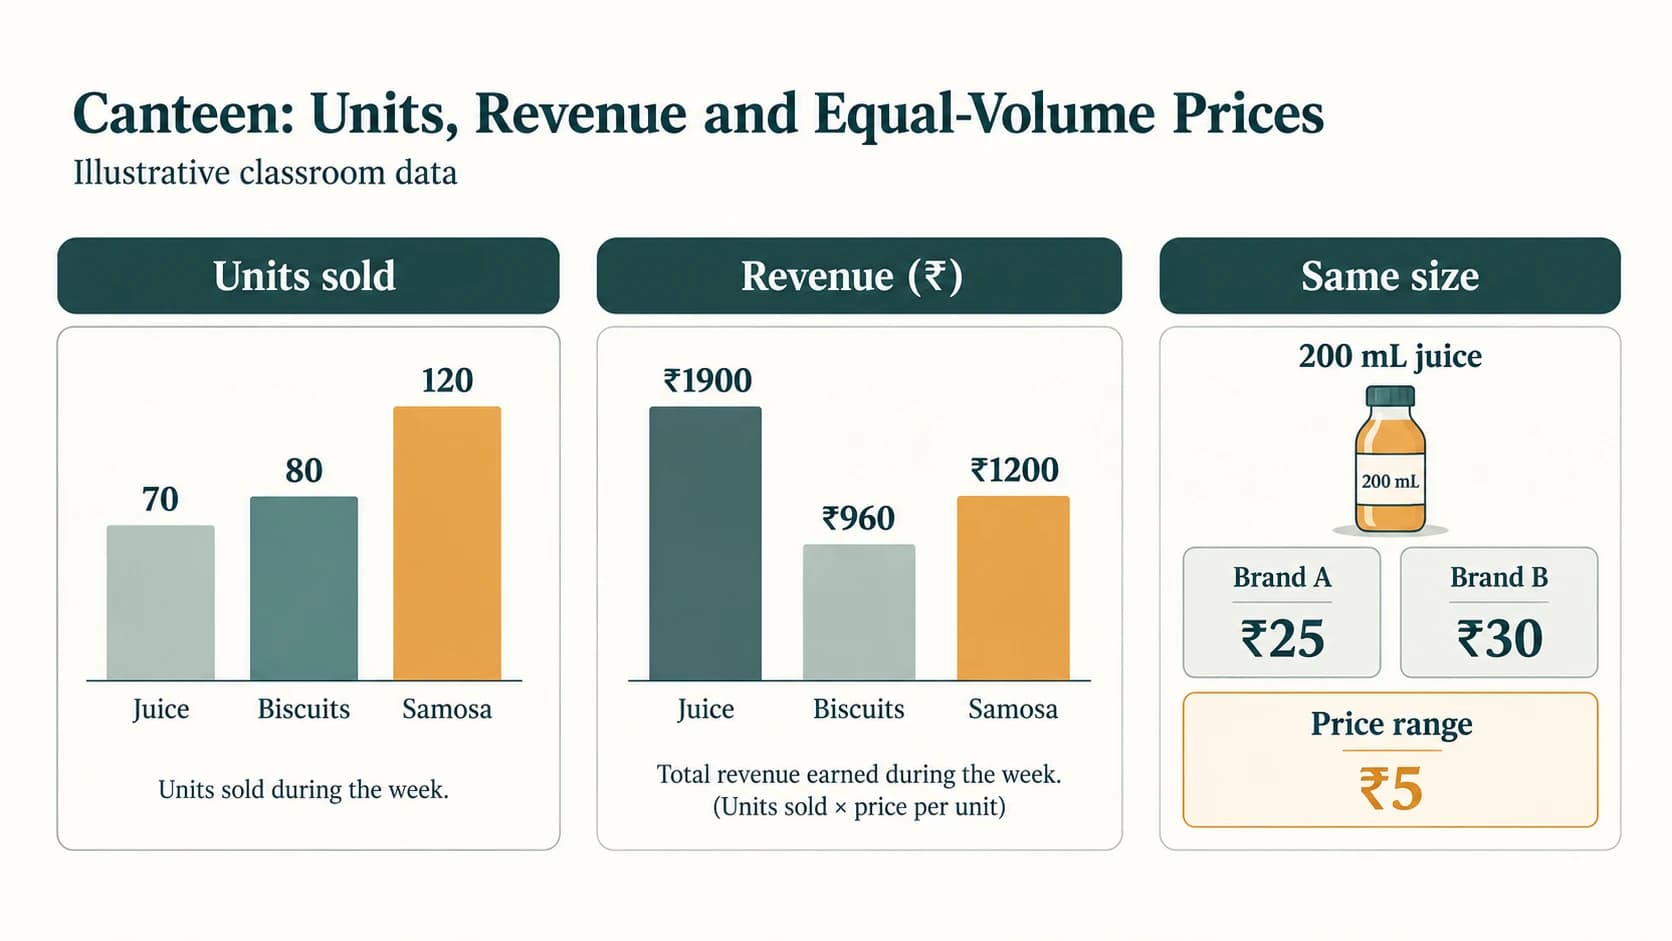
NCERT task: The school principal wants to compare (a) purchase versus sale price of fruit juice and biscuits, (b) sales of fruit juice, biscuits and samosa, and (c) sale prices of different-company fruit juices of the same volume. The book asks students to create an appropriate dataset; no real prices or quantities are supplied. The numbers below are explicitly fictional demonstration data, not reported NCERT prices or actual canteen transactions.
1. Design the dataset
| Product | Brand/variant | Unit size | Purchase price (₹/unit) | Sale price (₹/unit) | Units sold |
|---|---|---|---|---|---|
| Fruit juice | Brand A | 200 mL | 16 | 25 | 40 |
| Fruit juice | Brand B | 200 mL | 20 | 30 | 30 |
| Biscuits | Standard pack | 1 pack | 8 | 12 | 80 |
| Samosa | Standard serving | 1 piece | 7 | 10 | 120 |
Define per-unit gross difference as sale price − purchase price. For this simplified exercise, it is not net profit; rent, wastage, wages, taxes or packaging costs may also matter in real accounts.
2. Part (a): compare purchase and sale prices
| Product | Unit purchase ₹ | Unit sale ₹ | Gross difference ₹ | Markup on purchase cost |
|---|---|---|---|---|
| Juice A (200 mL) | 16 | 25 | 9 | 9/16 ×100 = 56.25% |
| Juice B (200 mL) | 20 | 30 | 10 | 10/20 ×100 = 50% |
| Biscuits | 8 | 12 | 4 | 4/8 ×100 = 50% |
Juice B has the highest per-unit rupee difference (₹10), but Juice A has the higher markup percentage (56.25%). Always specify whether the comparison concerns rupees, markup percentage or sales volume.
3. Part (b): compare sales of three product groups
| Group | Units sold | Sales revenue (₹) | Purchase cost for sold units (₹) | Gross difference (₹) |
|---|---|---|---|---|
| Fruit juice (A + B) | 70 | 1900 | 1240 | 660 |
| Biscuits | 80 | 960 | 640 | 320 |
| Samosa | 120 | 1200 | 840 | 360 |
Samosas have the highest unit count (120); fruit juice has the highest sales revenue (₹1,900) and gross difference (₹660). “Best-selling” is ambiguous unless you state whether it means units sold or rupee revenue. All calculations are for the illustrative period represented by this invented data.
4. Part (c): equal-volume fruit-juice price variation
Compare 200 mL packs only. Juice A sells for ₹25 and Juice B for ₹30, so range = ₹30 − ₹25 = ₹5 per equal-volume pack. The simple mean of the two displayed sale prices is ₹27.50. The population SD of the two equally weighted listed prices is ₹2.50. If averaging prices actually paid by purchasers, weight by units: (40×25 + 30×30) / 70 ≈ ₹27.14 per pack.
This illustrates why it matters whether you average product prices or individual transactions.
5. Runnable Python analysis (original classroom solution)
products = [
    {"group": "juice", "variant": "A", "size_ml": 200,
     "buy": 16, "sell": 25, "units": 40},
    {"group": "juice", "variant": "B", "size_ml": 200,
     "buy": 20, "sell": 30, "units": 30},
    {"group": "biscuits", "variant": "pack", "size_ml": None,
     "buy": 8, "sell": 12, "units": 80},
    {"group": "samosa", "variant": "piece", "size_ml": None,
     "buy": 7, "sell": 10, "units": 120},
]

totals = {}
for row in products:
    group = row["group"]
    totals.setdefault(group, {"units": 0, "revenue": 0, "gross": 0})
    totals[group]["units"] += row["units"]
    totals[group]["revenue"] += row["units"] * row["sell"]
    totals[group]["gross"] += row["units"] * (row["sell"] - row["buy"])

print(totals)
# {'juice': {'units': 70, 'revenue': 1900, 'gross': 660},
#  'biscuits': {'units': 80, 'revenue': 960, 'gross': 320},
#  'samosa': {'units': 120, 'revenue': 1200, 'gross': 360}}

juice_200ml = [r for r in products
               if r["group"] == "juice" and r["size_ml"] == 200]
price_range = max(r["sell"] for r in juice_200ml) - min(
    r["sell"] for r in juice_200ml
)
print(price_range)  # 5
Conclusion: This task combines a structured dataset, comparisons, aggregation and elementary statistical measures. It is not a separately numbered NCERT Exercise 10 in the supplied scan; it is an unnumbered exercise continuation on the final two pages.
Original Practice — 30 Questions with Explained Answers
These are original additional questions, not NCERT exercises. They are intended for revision, self-assessment, board-style reasoning and basic practical work.
Part A — Multiple-Choice Concepts (1–10)
Practice 1 — Which is an example of information rather than just recorded raw values?
Question: (A) An unordered list of 300 marks (B) A calculated class pass percentage with its denominator (C) An isolated student ID (D) A camera's unreviewed pixel data.
Answer: B. A computed pass percentage summarises individual records for a question; include the number of students considered to make it interpretable.
Practice 2 — What is a field in a structured table?
Question: (A) An entire spreadsheet (B) A named attribute such as StudentID (C) The keyboard (D) The order in which rows are printed.
Answer: B. A field or attribute identifies a type of value for each record.
Practice 3 — Which is best described as unstructured content?
Question: (A) A table with ID, date and score columns (B) A fixed-format fee record (C) The sound waveform of an interview recording (D) A school attendance matrix.
Answer: C. The interview recording's content does not follow the same simple, fixed table schema, though its file metadata can be structured.
Practice 4 — Which of these is photo metadata?
Question: (A) The picture's subject must be a tree (B) The file's pixel dimensions (C) Its emotional meaning (D) A prediction about the weather.
Answer: B. Dimensions describe the file rather than the depicted scene.
Practice 5 — What can happen if an outlier is large?
Question: (A) The mean is never affected (B) The median must always change (C) The mean may move significantly (D) All numerical values become unusable.
Answer: C. Extreme values can pull the mean away from a typical central observation; they do not automatically justify deleting data.
Practice 6 — What summarises the most common car colour?
Question: (A) Mean (B) Standard deviation (C) Range (D) Mode.
Answer: D. Colour is a category. Mode identifies the most frequent category.
Practice 7 — The range of [11, 4, 9, 4] is what?
Question: (A) 3 (B) 7 (C) 11 (D) 28.
Answer: B. Maximum 11 minus minimum 4 equals 7.
Practice 8 — Which expression is population variance for n numeric values?
Question: (A) sum(x)/n (B) max(x)-min(x) (C) sum((x-mean)**2)/n (D) sum(x**2).
Answer: C. The population variance is the average squared deviation; SD is its positive square root.
Practice 9 — Which is a valid reason to keep a database rather than independent disconnected text files?
Question: (A) All security issues vanish (B) Related records can be queried and updated consistently (C) No backups are needed (D) Every possible error is prevented.
Answer: B. A properly designed DBMS helps manage related structured data, although it still needs security, backups and quality controls.
Practice 10 — A result says “60%” but omits what was counted. What's missing?
Question: (A) Just the font (B) The denominator/definition and sample context (C) A sound file (D) An obligatory photo.
Answer: B. The numerator, denominator, time period and population definition make a percentage meaningful.
Part B — Calculations and Small Data Tables (11–18)
Practice 11 — Mean of five temperatures
Question: Find the mean of [18, 20, 22, 20, 25] °C.
Answer: Sum = 105, n=5, so mean = 21 °C. Do not confuse it with the most frequent value (20 °C).
Practice 12 — Median of an odd-sized unsorted list
Question: Find the median of [13, 7, 5, 11, 9].
Answer: Sort to [5, 7, 9, 11, 13]; the middle (third) value is 9. Sorting is essential for positional median.
Practice 13 — Median of an even-sized list
Question: Find the median of [6, 14, 8, 12].
Answer: Sort to [6, 8, 12, 14]. Mean of middle pair = (8+12)/2 = 10.
Practice 14 — Multiple modes
Question: Identify the modes of [2, 3, 3, 4, 4, 5].
Answer: 3 and 4, each occurring twice. The dataset is bimodal; returning just one mode would conceal the tie.
Practice 15 — Outlier effect
Question: Compare the means and medians of [10, 11, 12] and [10, 11, 120].
Answer: First: mean 11, median 11. Second: mean 47, median 11. The extreme 120 strongly changes the mean while the ordered middle remains 11.
Practice 16 — Population variance and SD
Question: Find population variance and population SD of [2, 4, 6].
Answer: Mean = 4. Squared deviations = 4, 0, 4, total 8. Variance = 8/3 ≈ 2.67; population SD = √(8/3) ≈ 1.63 (in the original units).
Practice 17 — Simple inventory value
Question: A stationery kiosk has 12 notebooks at ₹35 and 8 pens at ₹10. Find units and stock value before any discounts.
Answer: Units = 12+8 = 20. Value = 12×35 + 8×10 = 420+80 = ₹500. A unit count is not the same as a money value.
Practice 18 — Compare weighted and unweighted prices
Question: Product A sells 2 packs at ₹20 each; B sells 8 packs at ₹30 each. Find the unweighted average listed price and the transaction-weighted average.
Answer: Listed-price mean = (20+30)/2 = ₹25. Weighted mean = (2×20 + 8×30)/(2+8) = ₹28. Name the weighting scheme in a report.
Part C — Explain and Justify (19–24)
Practice 19 — Can the same file be both structured and unstructured?
Answer: A container such as an email can have structured fields (sender, timestamp) while its body or attachments contain unstructured content. Different aspects of the same object can be described differently.
Practice 20 — Why is a sample of only one shop potentially misleading for a city-wide claim?
Answer: One shop's clientele, prices and locality may not represent the entire city. A larger or more carefully selected sample, clear target population and documented collection design are needed for defensible generalisation.
Practice 21 — Why check missing values before computing a mean?
Answer: Mistaking missing data for zero or dividing by the wrong count can distort the result. Define whether to exclude, correct or explicitly represent each missing observation; disclose the rule used.
Practice 22 — Why should a student’s identity number not be used as a numerical measurement?
Answer: An identity number is an identifier, not a measurement. Averaging two IDs does not produce meaningful information about students. The distinction depends on the field's purpose, not whether it contains digits.
Practice 23 — When is range less informative than standard deviation?
Answer: Range uses only extremes, so two datasets can have the same maximum and minimum but very different interior distributions. Standard deviation uses every numeric observation to describe variation around the mean.
Practice 24 — How do summary statistics support but not prove a conclusion?
Answer: A higher average is a descriptive finding; it does not establish why one group scored higher or that an intervention caused the difference. Check sample sizes, comparability, missing data and alternative explanations.
Part D — Applied Python and Data Design (25–30)
Practice 25 — Write a function for mean with an empty-data check
Solution:
def safe_mean(values):
    if not values:
        raise ValueError("At least one value is required")
    return sum(values) / len(values)

print(safe_mean([4, 6, 8]))  # 6.0
Explanation: Validating emptiness avoids ZeroDivisionError and makes the function's contract explicit.
Practice 26 — Find all most-frequent categories
Solution:
from collections import Counter

def all_modes(items):
    if not items:
        return []
    frequencies = Counter(items)
    peak = max(frequencies.values())
    if peak == 1:
        return []  # the NCERT convention: no mode if each is unique
    return [value for value, count in frequencies.items() if count == peak]

print(all_modes(["red", "blue", "red", "blue", "green"]))
# ['red', 'blue']
Explanation: A tie is possible. The function uses the chapter's convention that all-unique values have no mode.
Practice 27 — Compare attendance counts by category
Solution:
from collections import Counter

attendance = ["Present", "Absent", "Present", "Present", "Absent"]
print(dict(Counter(attendance)))
# {'Present': 3, 'Absent': 2}
Explanation: A frequency table, not an arithmetic mean of words, is the natural summary for categorical attendance.
Practice 28 — Compute the range of a list safely
Solution:
def data_range(numbers):
    if not numbers:
        raise ValueError("Cannot compute range of an empty list")
    return max(numbers) - min(numbers)

print(data_range([22, 18, 30, 27]))  # 12
Explanation: The output uses the same units as the measurements. Only the maximum and minimum determine the range.
Practice 29 — Build a data schema for a library-loan table
Question: Propose structured fields for a library to record borrowed books.
Answer: Suggested fields: loan_id, book_copy_id, borrower_id, issue_date, due_date, return_date, status. Link the copy and borrower to authorised records rather than duplicating every personal detail in each loan. The loan is one row; each label is an attribute. For an overdue query, compare due_date with the relevant date only for loans not marked returned.
Practice 30 — Compare two classes without fabricating results
Question: Class A has marks [65, 75, 85]; Class B has [70, 75, 80]. Compare mean and population SD.
Answer: Both have mean 75. For Class A, squared deviations are 100,0,100, giving SD √(200/3) ≈ 8.16. For B, squared deviations are 25,0,25, giving SD √(50/3) ≈ 4.08. Their average performances are the same in this toy dataset, while B's scores are more tightly clustered. The data are fictional and far too small to support generalisations about actual school classes.
Quick Revision — Understanding Data at a Glance
Essential concepts
| Term | In one sentence |
|---|---|
| Data | Recorded facts, symbols, measurements and observations |
| Information | Data organised or processed for a particular question |
| Structured data | Consistent named fields in a schema, often rows and columns |
| Unstructured data | Flexible content not confined to one fixed tabular arrangement |
| Metadata | Descriptive attributes of another item or record |
| Data collection | Obtaining relevant observations from defined sources |
| Data storage | Preserving data for later retrieval or processing |
| Processing | Validating, transforming, summarising or otherwise operating on inputs |
| Mean | Sum divided by count |
| Median | Middle of ordered values (or mean of two middle values) |
| Mode | Most common value/category, with possible ties |
| Range | Maximum minus minimum |
| Population SD | Square root of mean squared deviation from mean |
Formula strip
Median: first sort. For odd n, choose middle index n//2; for even n, average indices n//2 - 1 and n//2.
Common exam traps
- Index vs position: Python index begins at zero; natural-language position often begins at one.
- Mean vs mode: mean measures numeric average, while mode finds the frequent category/value.
- Median before sorting: the middle of an unsorted list is not necessarily the median.
- Outliers: investigate before removal; a genuinely extreme record can be important.
- Spread: equal means do not imply equal ranges or standard deviations.
- SD denominator: the population formula used here divides by
n; a sample estimator may divide byn−1. - Counts and percentages: always state the denominator and the period.
- Categorical divisions: frequencies and mode are meaningful; averaging arbitrary labels is not.
- Personal data: synthetic datasets avoid disclosing identifiers, biometrics and balances.
- Canteen question: the extra task following NCERT Exercise 9 is unnumbered, not a silently assumed Exercise 10.
Viva / oral questions and model answers
What is the difference between a record and an attribute? A record is one row/observation; an attribute is a named column such as price or date.
Can text be structured data? Yes. Text values placed into defined fields, such as names in a column, are structured.
What is an outlier? An unusually large or small observation relative to other values; it may be valid or erroneous and must be evaluated.
When is the median preferable to the mean? When an extreme value would make the arithmetic mean unrepresentative of a typical central value.
Why do we calculate standard deviation? To describe how dispersed all numeric observations are around their mean.
Can a list have more than one mode? Yes, several values may tie at the highest frequency.
What does a very small standard deviation suggest? Observed numeric values are relatively close to their mean, on the same measurement scale.
Which statistical measure counts alumni parents? A frequency/count of records where both parent-alumni indicators are true; it is not inherently a mean or median calculation.
What is the first step in responsible processing? Define the question, required fields and legitimate data source, then validate the observations.
Does storing a CSV automatically make its contents correct? No. Storage format does not guarantee correct entries, completeness or validity.
Student self-check
- I can explain data, information, records, attributes and metadata.
- I can classify textbook examples while accounting for mixed-format objects.
- I can plan collection and storage without exposing personal information.
- I can describe the input–processing–output cycle and NCERT's service examples.
- I can compute mean, median, mode, range and population SD by hand and with Python.
- I can explain when the mean is sensitive to an outlier.
- I have solved NCERT Exercises 1–9, Activity 7.1 and the unnumbered canteen task.
- I can answer the 30 additional practice questions with reasoning.