How Do Cricket Teams Use Data and Video to Study Opponents?
Learn how cricket teams combine ball-by-ball data, video, matchup analysis, pitch maps and scenario planning to study opponents and build match strategies.
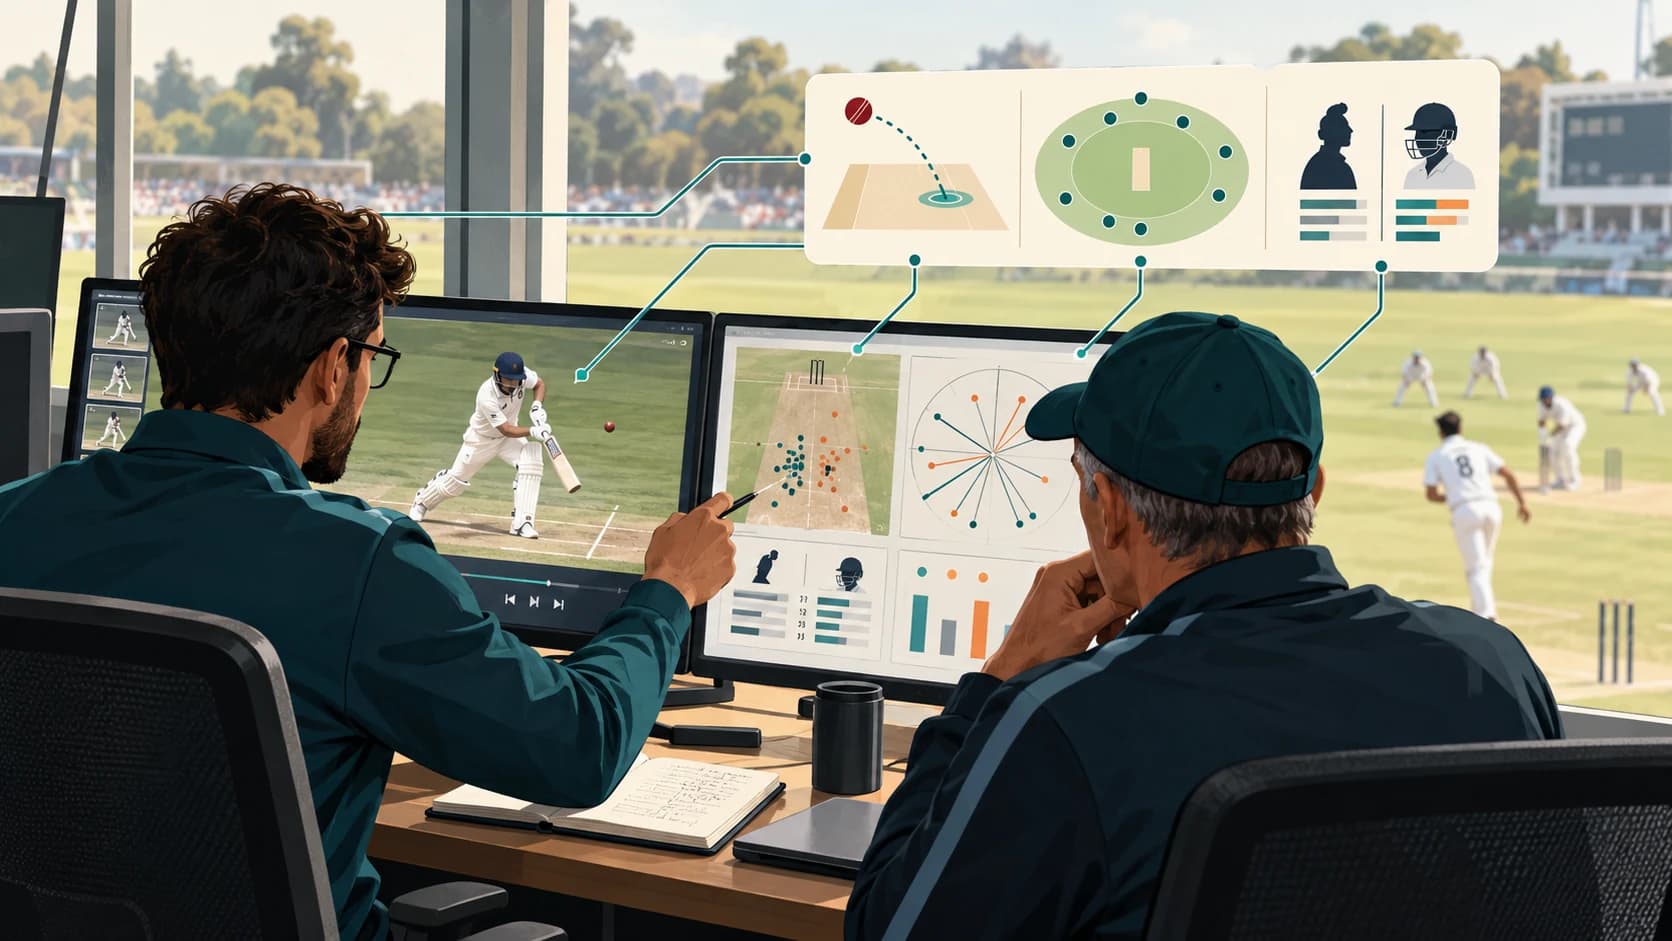
A fast bowler is preparing to face a dangerous opening batter.
Before the match begins, the bowler may already know things such as:
- how often the batter scores against short balls,
- whether the batter attacks outside off stump early in the innings,
- which lengths have produced dismissals,
- how the batter performs against high pace,
- whether the batter becomes more aggressive after a certain number of deliveries,
- where previous boundaries were scored.
The bowler does not need to remember every innings the opponent has ever played.
A performance analyst can search years of ball-by-ball data and video in minutes.
That is what modern opposition analysis is really about.
Cricket teams now combine:
data
video
tracking technology
statistical models
coaching judgement
to answer one practical question:
What should we do differently against this opponent?
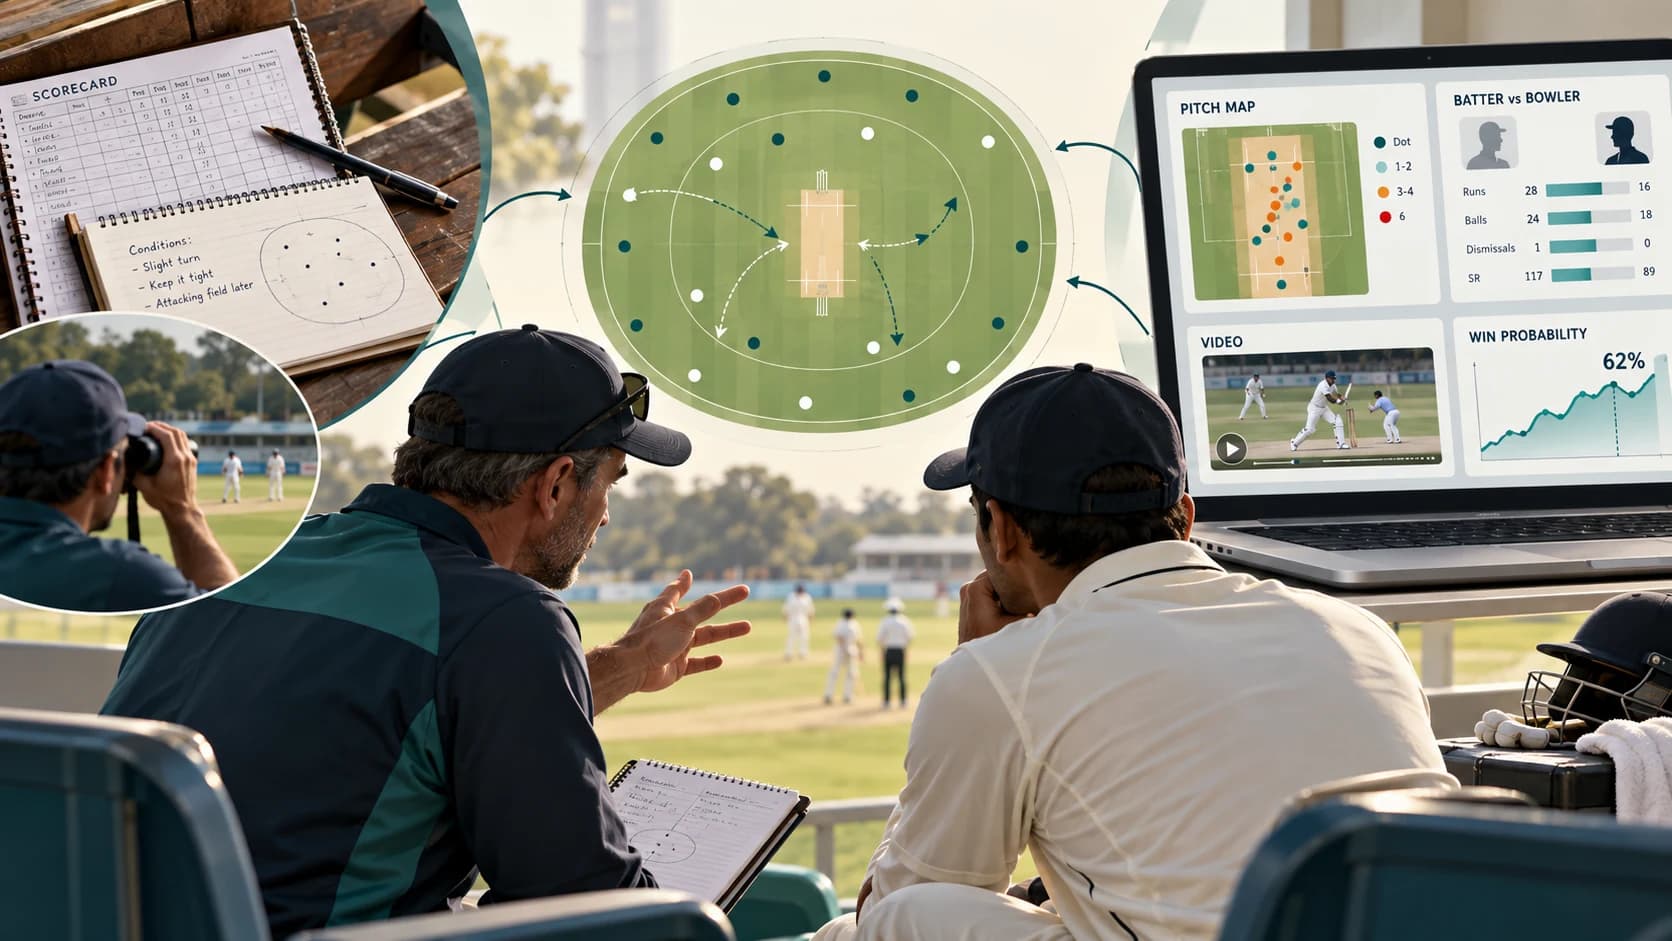
Companies such as CricViz and Stats Perform now provide professional teams with tools specifically designed for opposition analysis, matchup planning, selection and in-game tactics. CricViz says its analysts combine data, video and coaching experience to develop opposition plans, while Stats Perform describes cricket analysis products built around historical performance, player matchups and predictive simulations.
But good analysis is not simply producing more numbers.
The hardest part is turning thousands of deliveries into a plan simple enough for a player to remember when the bowler starts running in.
The Process Starts With a Huge Ball-by-Ball Database
Every cricket match produces structured information.
A basic scorecard records:
- runs,
- wickets,
- overs,
- batting scores,
- bowling figures.
Professional analysis goes much deeper.
CricViz says its database contains detailed records for major cricket and can include up to 30 data points for every ball, covering not just the result but information such as ball type, shot selection and fielding activity.
Stats Perform similarly says detailed Opta cricket data is collected across millions of deliveries and used to build advanced performance metrics.
For one delivery, an analyst might have fields describing:
- batter,
- bowler,
- innings phase,
- line,
- length,
- pace,
- bowling type,
- shot type,
- runs,
- dismissal,
- fielding result,
- match situation.
Where tracking data is available, additional information may include:
- release speed,
- pitching location,
- bounce height,
- movement,
- trajectory.
CricViz's Centurion platform says it can integrate official third-party ball-tracking data from systems such as Hawk-Eye and Virtual Eye to analyse bowling speed, line and length.
That turns cricket into something searchable.
Instead of remembering an opponent's last ten matches, the analyst can ask a database a very specific question.
Analysts Do Not Ask “Is This Batter Good?”
They ask narrower questions.
For example:
How does this batter perform against left-arm pace in the first 20 balls of an innings?
Or:
What happens when right-arm fast bowlers attack from around the wicket and pitch back of a length?
Or:
Which areas of the field produce most of this batter's boundaries against spin?
These questions are much more useful than broad statistics such as batting average.
A batter might average 48 overall but struggle badly against one particular matchup.
Another batter may have an ordinary career average but be extremely dangerous against the bowling attack selected for a particular match.
That is why modern analysis often breaks performance into contexts.
Matchup Analysis: Batter Versus Bowler Type
One of the most common forms of opposition analysis is the matchup.
Suppose Team A is preparing to face a batter who is particularly strong against conventional off-spin but much less productive against left-arm wrist spin.
The analyst can compare:
- runs per ball,
- dismissal rate,
- boundary percentage,
- dot-ball percentage,
- shot selection,
- scoring zones,
against those bowling types.
Stats Perform specifically markets matchup analysis to professional cricket teams, allowing analysts to compare batter and bowler combinations and use advanced metrics to inform tactics.
CricViz likewise says its tools can disaggregate player performance according to opposition strategy and match situations.
This does not automatically mean:
Batter struggles against left-arm wrist spin → always bowl left-arm wrist spin.
The sample may be small.
The pitch may not suit spin.
The available bowler may not be good enough.
The match situation may demand something else.
But the matchup gives the coaching staff a question worth exploring.
Video Turns the Numbers Into Something Players Can See
Numbers can reveal a pattern.
Video helps explain it.
Imagine the data says a batter has been dismissed repeatedly against full deliveries outside off stump.
The analyst can instantly pull up the relevant clips.
Now the coach and player can look for the reason.
Perhaps the batter:
- plants the front foot too early,
- reaches away from the body,
- drives on the up,
- opens the bat face,
- struggles when the ball swings away.
CricViz's Centurion platform integrates ball-by-ball video with data, allowing analysts, players and coaches to search for specific events and immediately watch the corresponding clips.
That is much more useful than manually searching through hours of match footage.
An analyst can effectively say:
Show every ball this batter faced from right-arm fast bowlers, outside off stump, in the first ten overs, that resulted in a false shot.
Then review the video evidence behind the statistic.
Pitch Maps Reveal Where Bowlers Should Aim
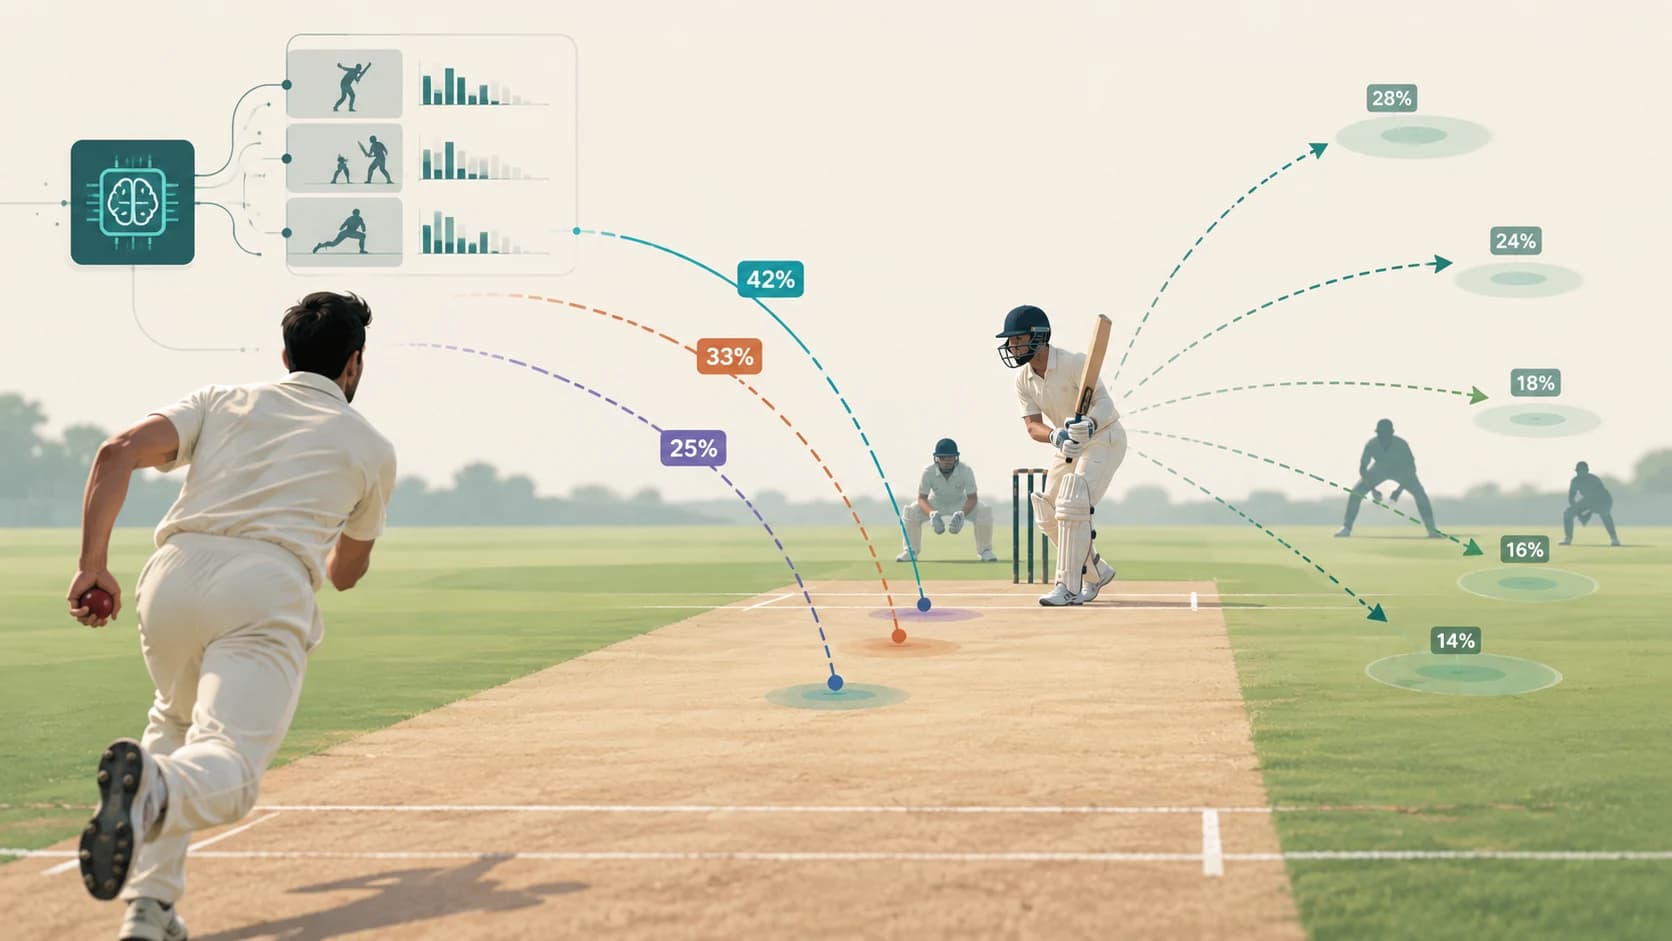
A pitch map plots where deliveries landed.
Take hundreds of balls bowled to one batter and patterns can become visible.
Perhaps the batter:
- scores heavily from overpitched balls,
- leaves well outside off stump,
- struggles against a length that attacks the top of off,
- pulls short balls efficiently,
- is vulnerable to yorkers at the death.
CricViz's current visualisation tools include pitch maps that can be filtered by opponent, bowling style and outcome.
The analyst can colour the map by:
- runs,
- wickets,
- dot balls,
- false shots.
Now the coach does not just say:
Bowl a good length.
The plan can become much more specific:
Stay slightly fuller than normal, attack fourth stump, and avoid feeding width.
For a professional bowler, that is actionable information.
Wagon Wheels Show Where the Batter Scores
A wagon wheel maps where a batter's scoring shots travel around the field.
This can help answer:
- Does the batter score mostly through the leg side?
- Are boundaries concentrated square of the wicket?
- Does the batter rarely hit straight against spin?
- Where might a boundary rider save the most runs?
Combine that with shot-type data and the analyst can build a fielding plan.
For example:
If a batter repeatedly sweeps a particular spinner behind square, the captain may place a fielder specifically for that shot.
But field placement is not dictated by a chart.
The bowling plan and field must work together.
A deep square-leg fielder is useful only if the bowler can deliver the ball that encourages the intended shot.
Analysts Study Phases, Not Just Whole Innings
White-ball cricket changes dramatically from one phase to another.
A batter's approach in the powerplay may be completely different from the death overs.
So analysts often divide an innings into phases such as:
- powerplay,
- middle overs,
- death overs.
Then they ask separate questions.
Powerplay
- Does the batter attack immediately?
- What happens against swing?
- Which bowlers produce early dismissals?
- Where are the boundary areas?
Middle overs
- How does the batter rotate strike?
- Which spin matchups slow scoring?
- What happens when the field spreads?
Death overs
- Which yorker lines work?
- Does the batter move across the crease?
- Is the slower ball effective?
- Which boundary zones are targeted?
This matters because averages across the whole innings can hide the actual tactical problem.
A batter may dominate pace overall but struggle specifically against slower balls in the final five overs.
That is the information the death bowler needs.
Bowlers Are Studied in the Same Way
Opposition analysis works both ways.
Batters study bowlers too.
Before facing a fast bowler, the batting analyst may review:
- average speed,
- new-ball swing,
- preferred length,
- bouncer frequency,
- yorker accuracy,
- slower-ball usage,
- over-the-wicket versus around-the-wicket patterns.
Against a spinner, the analysis may focus on:
- stock delivery,
- variation frequency,
- changes in pace,
- release position,
- drift,
- turn,
- preferred field settings.
Video can reveal cues that are difficult to capture in traditional statistics.
For example:
- a slower ball may come from a slightly different wrist position,
- a spinner's variation may use a different release,
- a bowler may repeatedly use the same ball after being hit for four.
The player can then train specifically for that situation.
Teams Analyse Sequences, Not Just Individual Balls
This is where opposition analysis becomes more tactical.
A bowler may not be dangerous because of one delivery.
The danger may come from a sequence.
For example:
wide outswinger
↓
wide outswinger
↓
straighter ball at the stumps
If several dismissals come from that pattern, the analyst can identify the setup.
The same applies to spin.
A bowler might repeatedly use:
stock ball
↓
stock ball
↓
quicker variation
The batter's problem may not be the variation alone.
It may be how the previous two balls prepared the dismissal.
Good analysis therefore studies patterns across overs, spells and match situations rather than treating every delivery as independent.
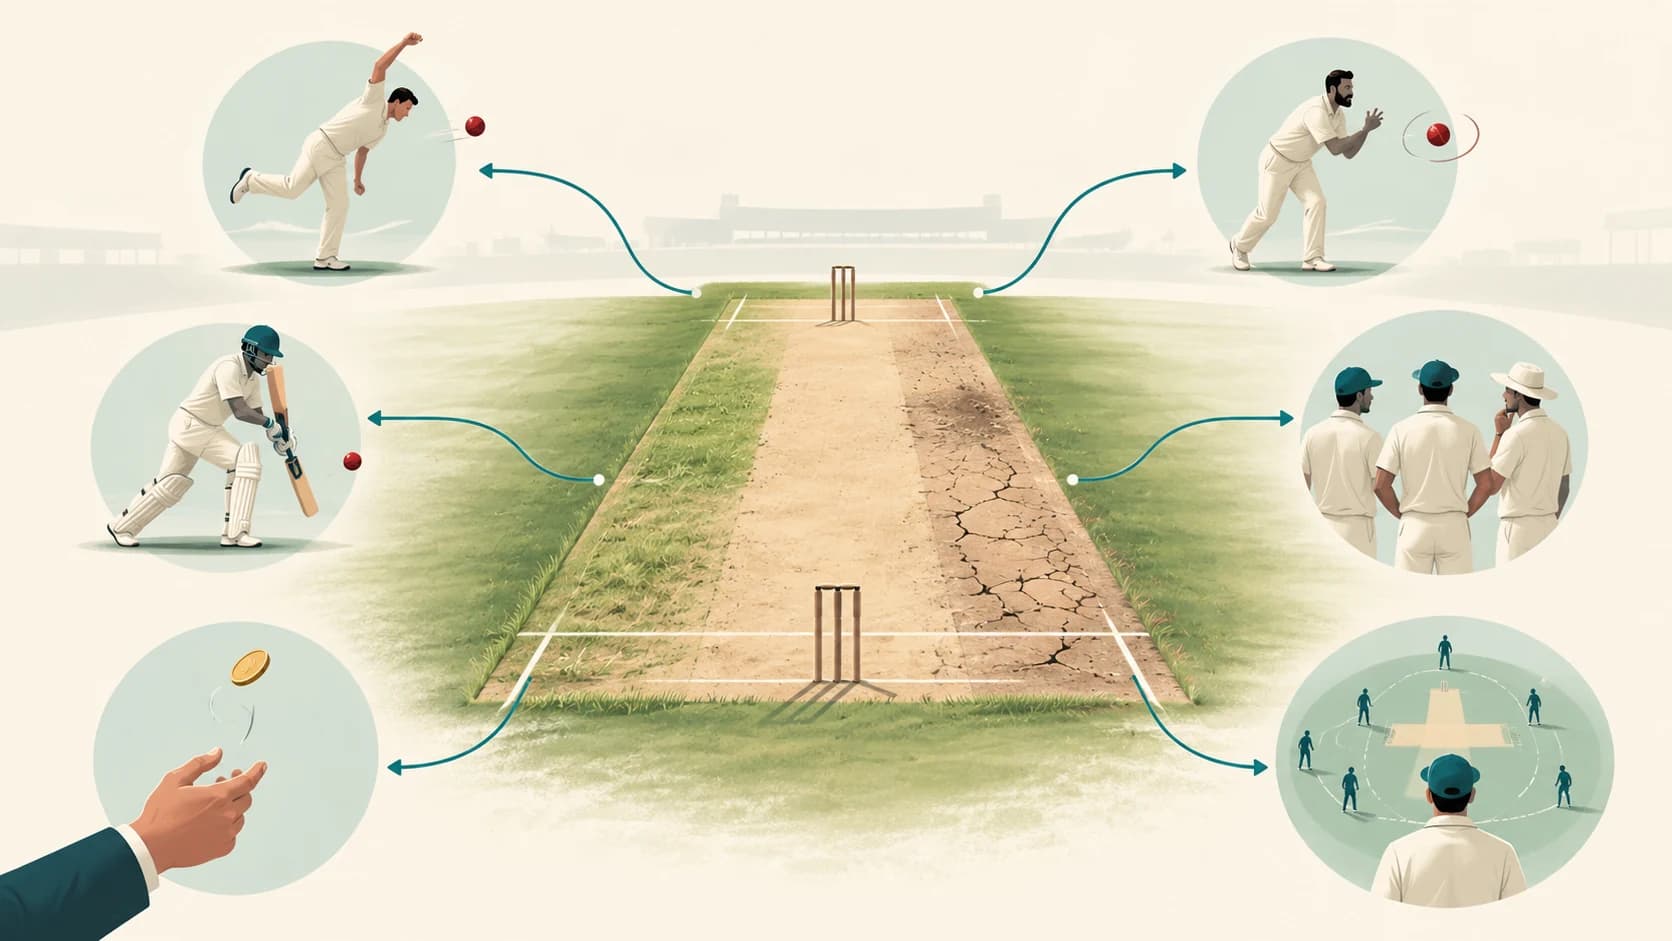
Venue and Pitch Conditions Change the Meaning of the Data
A matchup that worked in Chennai may not work the same way at Perth.
The surface, boundaries and weather affect tactics.
Stats Perform's cricket analysis products explicitly allow teams to review historical venue conditions along with player and opposition performance when preparing selection and match plans.
Analysts may study:
- average first-innings score,
- pace versus spin effectiveness,
- boundary dimensions,
- new-ball movement,
- how quickly the pitch slows,
- typical scoring areas,
- chasing versus defending results.
A player weakness that matters on one ground may be irrelevant on another.
For example, a batter vulnerable to short bowling may be more difficult to attack that way on a slow surface where the ball sits up rather than hurries through.
Context changes the plan.
Teams Build “Opposition Packs”
Before a match or series, analysts often prepare concise reports for coaches and players.
A performance analyst's role can include exactly this kind of work.
A 2024 Bangladesh Cricket Board vacancy for the men's national-team Performance Analyst listed responsibilities including:
- match previews and reviews,
- access to data and video,
- individual player analysis,
- opposition analysis that helps shape team strategy and match preparation.
The final presentation is unlikely to be a giant spreadsheet handed to every player.
Instead, the analyst might produce:
Batter profile
- strongest scoring areas,
- preferred matchups,
- dismissal patterns,
- useful video clips.
Bowler profile
- typical lengths,
- major variations,
- plans at different stages,
- changes under pressure.
Team profile
- powerplay style,
- middle-over strategy,
- death-overs strengths,
- likely batting-order changes,
- bowling rotation.
The goal is not to tell players everything.
It is to tell them what is most likely to matter.
Training Can Be Designed Around the Analysis
Opposition analysis becomes much more useful when it changes practice.
Suppose the data shows the next opponent's left-arm quick frequently attacks batters with short balls from around the wicket.
The batting coach can recreate that angle in the nets.
Or suppose an opposition batter struggles against wide yorkers at the death.
The bowlers can practise repeatedly hitting that zone before the game.
The sequence becomes:
Analysis identifies pattern
↓
Coach chooses a response
↓
Training reproduces the problem
↓
Player rehearses the solution
This is where analytics stops being a statistics exercise and becomes performance preparation.
CricViz explicitly describes its player-development work as feeding analysis into coaching and training decisions for specific matchups.
Models Can Test “What If?” Scenarios
Some professional tools go beyond historical summaries.
Stats Perform says its cricket models can simulate in-game matchups and produce predictive outputs such as:
- next-ball predictions,
- win probability,
- team-score projections,
- player-score projections.
Its match-analysis tools also describe simulations that can test different players and scenarios thousands of times.
A team might ask:
What changes if we use our left-arm spinner against this batter instead of saving him for later?
Or:
Which batting order gives us the best expected outcome against this bowling attack?
These models do not know the future.
They generate estimates from historical data and assumptions.
That makes them decision-support tools, not instructions that a captain has to obey.
In-Game Analysis Continues After the Match Starts
Opposition analysis is not finished at the toss.
The analyst can compare what is happening with what was expected.
Perhaps the opposing bowler:
- is bowling slower than usual,
- has abandoned the expected short-ball plan,
- is using a different angle,
- is targeting another side of the field.
Or a batter may change approach completely.
Real-time event data allows analysts and coaching staff to update their understanding during the match.
Stats Perform says live Opta data can be used for in-game decision support, while CricViz describes match-management tools designed to help coaches and captains respond to specific match situations.
In cricket, where teams have natural breaks between overs, innings and sessions, fresh information can sometimes reach players without interrupting play.
Why Analysts Must Be Careful With Small Samples
This is one of the biggest traps in cricket analysis.
Suppose:
Batter A vs Bowler B
shows:
- 24 balls,
- 2 dismissals,
- 18 runs.
It is tempting to say:
Bowler B owns this batter.
But 24 balls is tiny.
Maybe one dismissal came from a poor shot.
Maybe another came on an unusually difficult pitch.
Maybe the batter has improved since then.
Matchup numbers become less reliable as the sample becomes smaller.
Good analysts therefore consider:
- sample size,
- recency,
- venue,
- quality of opposition,
- match format,
- player development.
CricViz's player-rating models, for example, explicitly account for factors such as opposition quality and how long ago performances occurred.
A statistic without context can create a worse plan than no statistic at all.
Correlation Does Not Automatically Reveal the Cause
Suppose a batter has a low average against left-arm pace.
That tells you what has happened.
It does not automatically tell you why.
Possible explanations include:
- genuine technical weakness,
- difficult opponents,
- small sample,
- pitches favouring seam,
- batting position,
- match situation.
That is why video and coaching expertise remain important.
The data identifies the pattern.
The coach helps interpret the cricket behind it.
CricViz describes its performance-analysis approach as combining data and video with coaching experience rather than treating the database as a replacement for cricket judgement.
Can Analysis Tell a Team Exactly How to Win?
No.
Cricket is too uncertain.
A perfect plan can fail because:
- the bowler misses the intended length,
- the batter plays an exceptional shot,
- conditions change,
- a catch is dropped,
- a player improvises.
The opposition also has analysts.
They may know your plan.
And players deliberately adapt when weaknesses become obvious.
That makes professional cricket a continuous tactical cycle:
Team finds weakness
↓
Opponent adjusts
↓
Team analyses adjustment
↓
New plan develops
The more established a player becomes, the more data opponents usually have.
Success itself creates more evidence for rivals to study.
What Does a Player Actually Receive?
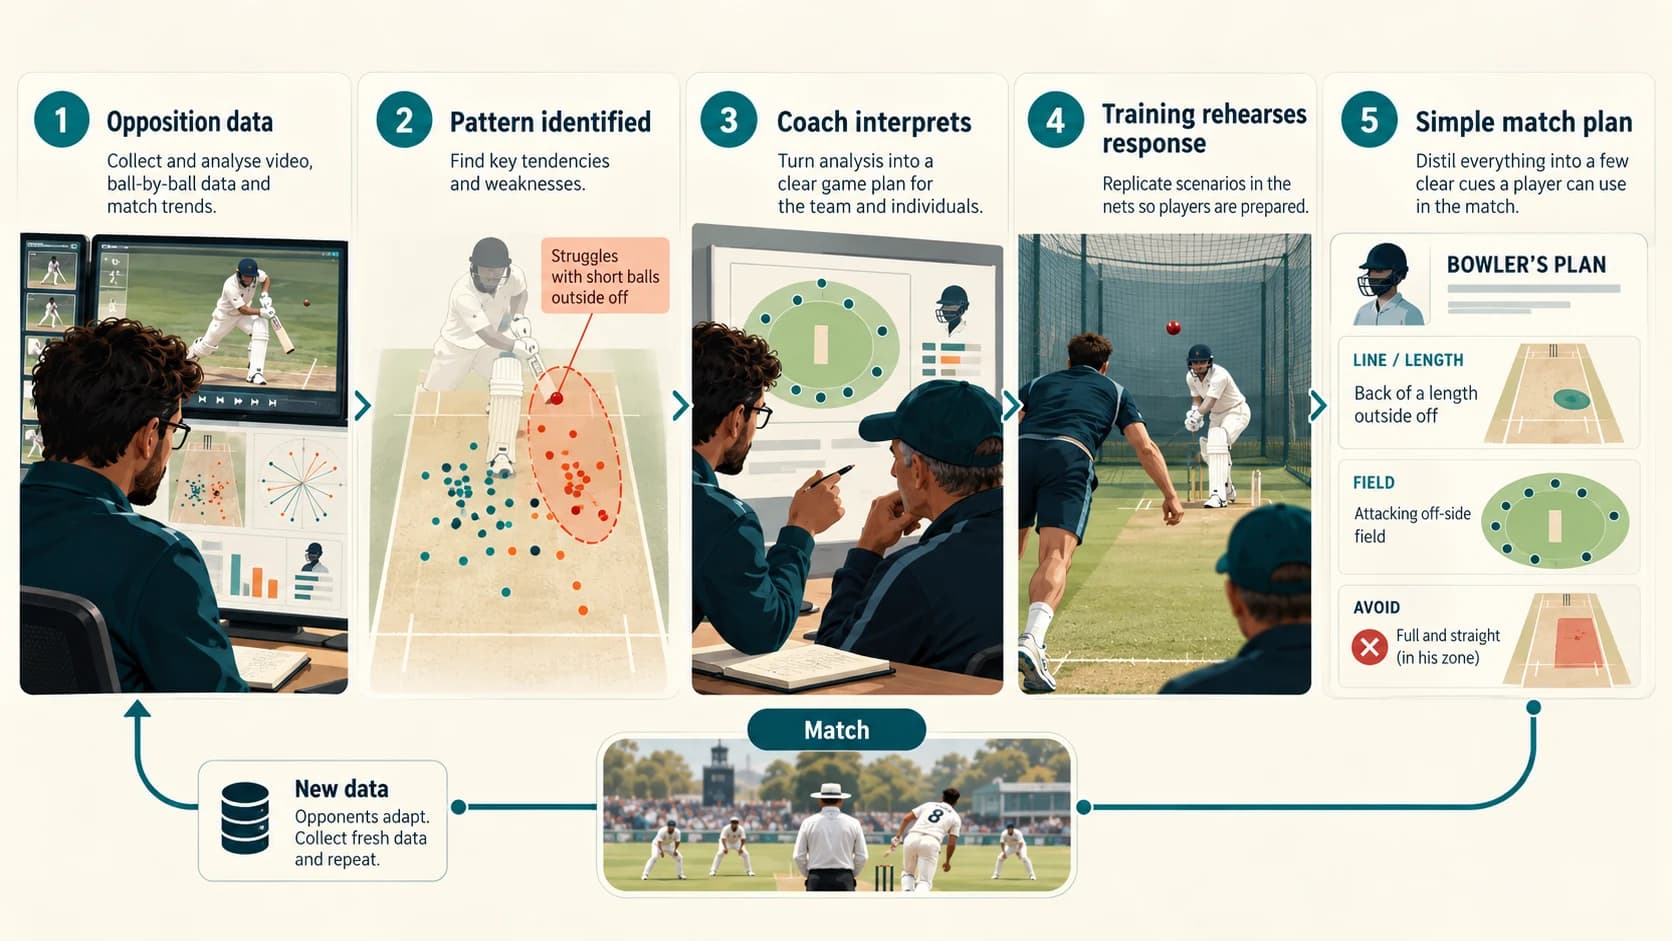
A useful opposition briefing might be surprisingly simple.
Imagine a bowler preparing for Batter X.
Instead of receiving 50 statistics, the bowler might receive:
Plan A
New ball: fourth-stump line, good length, protect cover.
Plan B
If batter attacks: slightly shorter, bring deep square into play.
Avoid
Do not overpitch on the pads.
Evidence
Three short video clips showing:
- two dismissals,
- one high-risk scoring pattern.
That is enough.
The analyst may have used millions of historical deliveries to reach the conclusion.
The player needs perhaps three sentences.
That compression is one of the most important skills in professional performance analysis.
Modern Cricket Analysis Is Really a Search for Repeatable Patterns
The purpose of opposition analysis is not to turn cricket into mathematics.
It is to reduce uncertainty.
A team cannot know what the opponent will do on the next ball.
But it can know what the opponent has tended to do in similar situations.
Modern tools make those tendencies much easier to find.
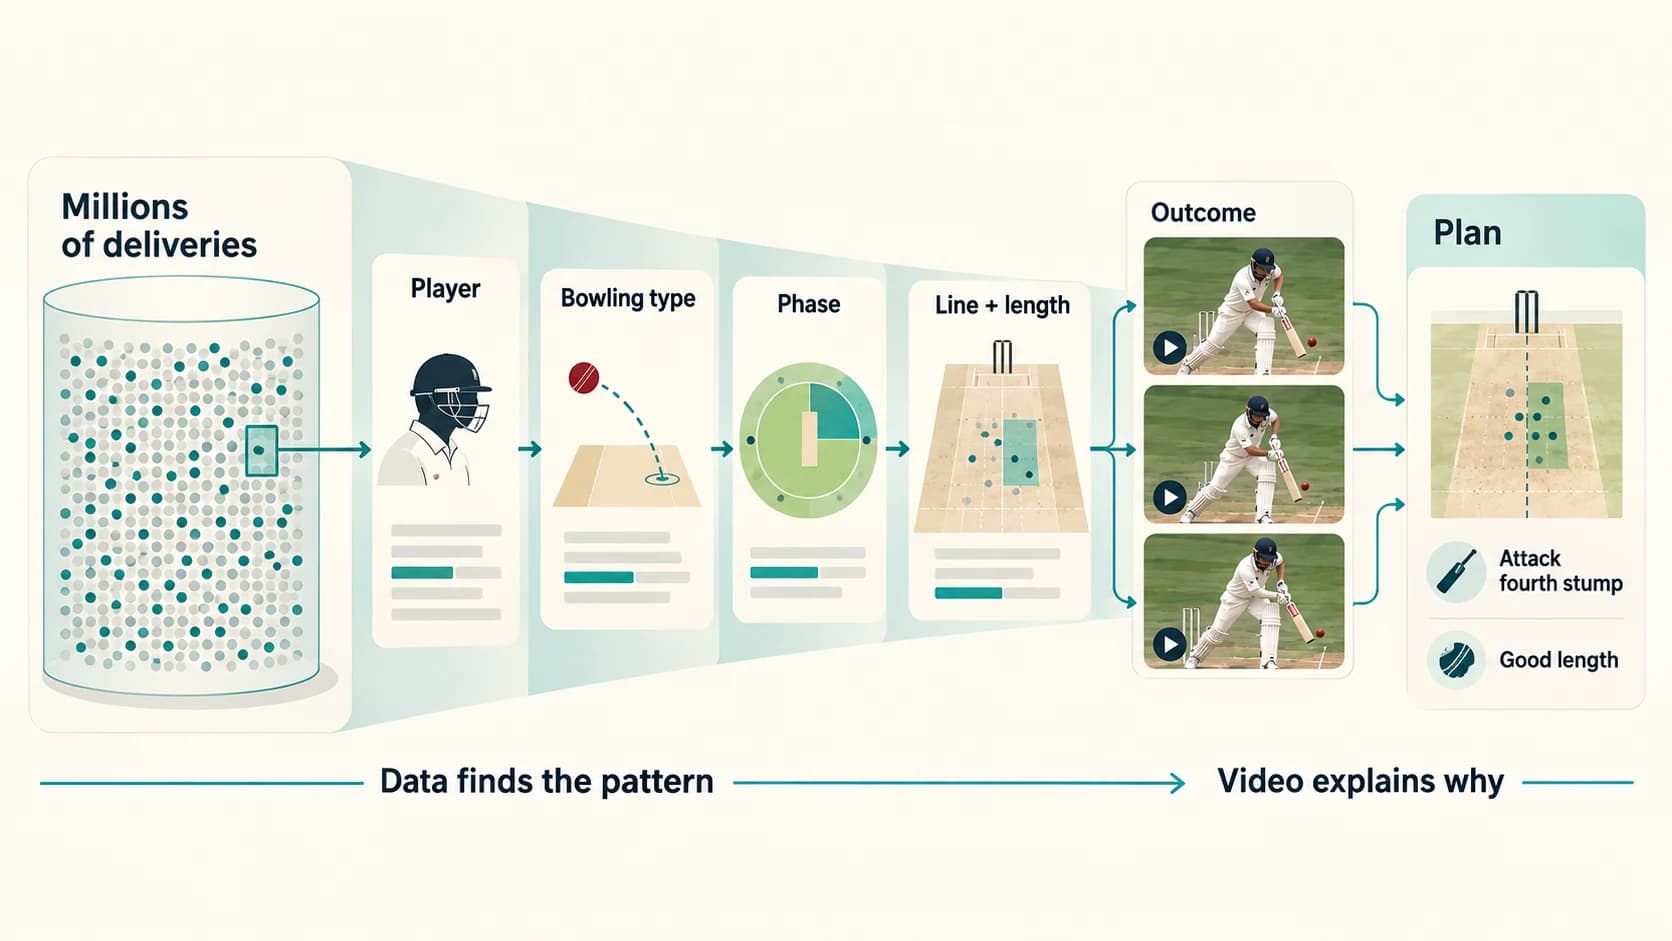
A performance analyst can search:
thousands of matches
↓
filter to:
one player
↓
then:
one bowling type
↓
then:
one phase
↓
then:
one line and length
↓
and instantly retrieve:
the statistics and video clips.
From there, the coaching staff asks the most important question:
Is this pattern real enough—and useful enough—to build a plan around?
That is how modern teams study opponents.
Not by replacing cricket instinct with spreadsheets.
But by giving players and coaches a much larger memory than any individual could possibly have.
The database remembers every delivery.
The video shows what actually happened.
The models highlight possible patterns.
And the humans decide which of those patterns are worth taking onto the field.