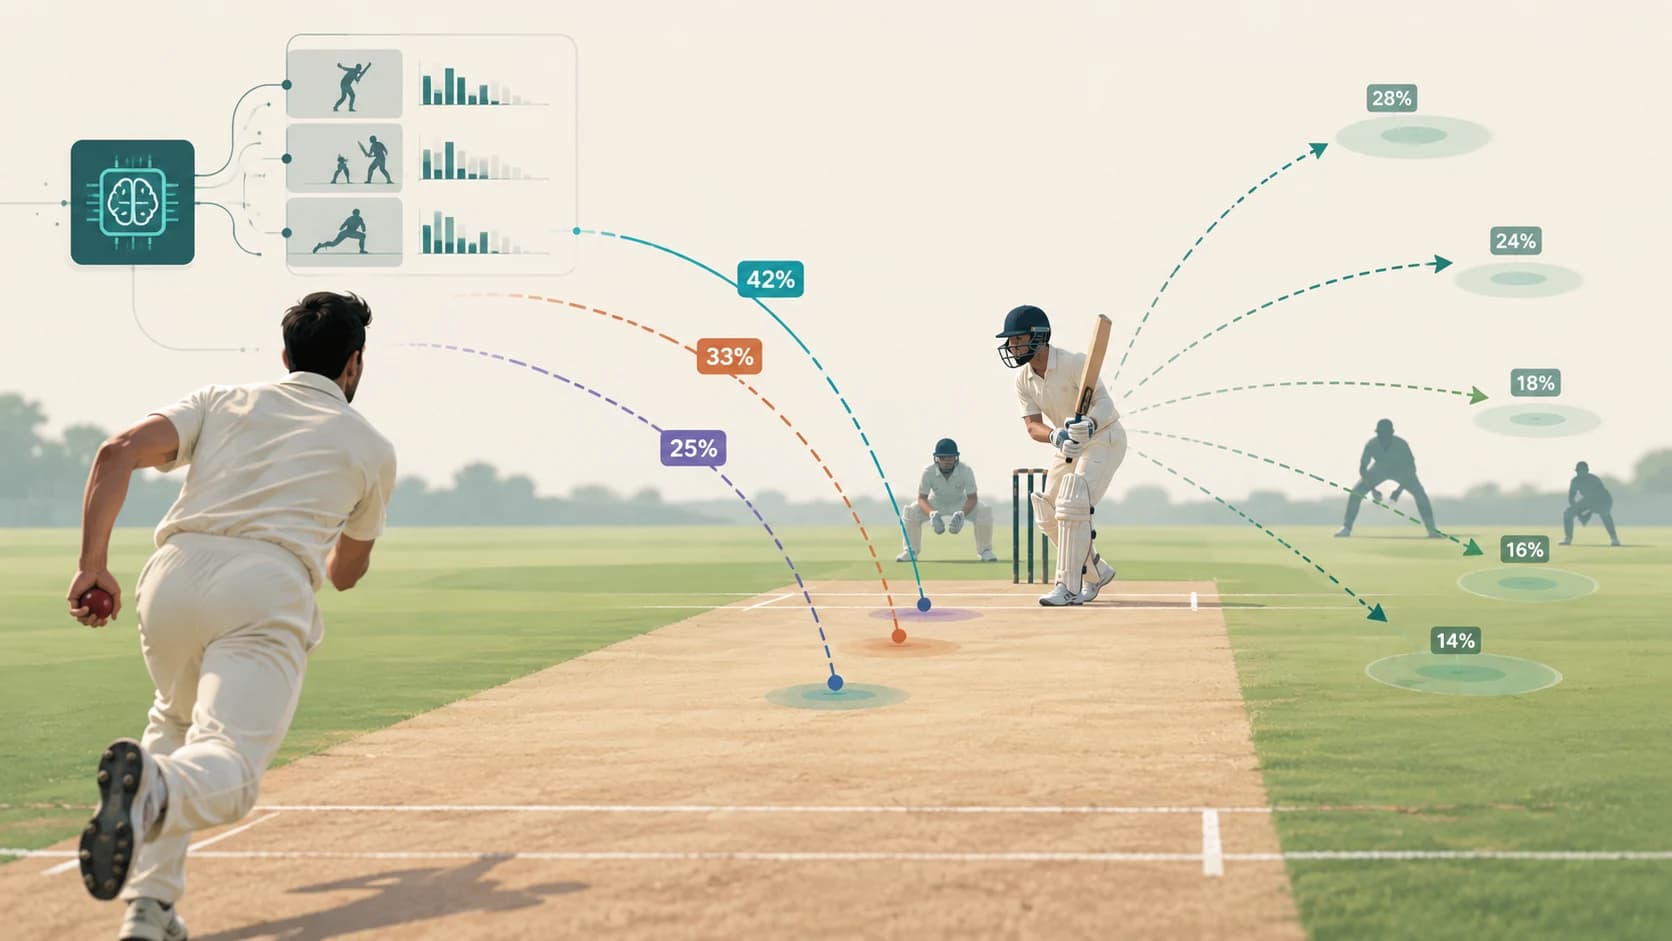
How Has Data Analytics Changed Cricket Strategy?
Learn how ball-by-ball data, matchup analysis, predictive models and video have changed cricket selection, batting orders, bowling plans, field settings and recruitment.
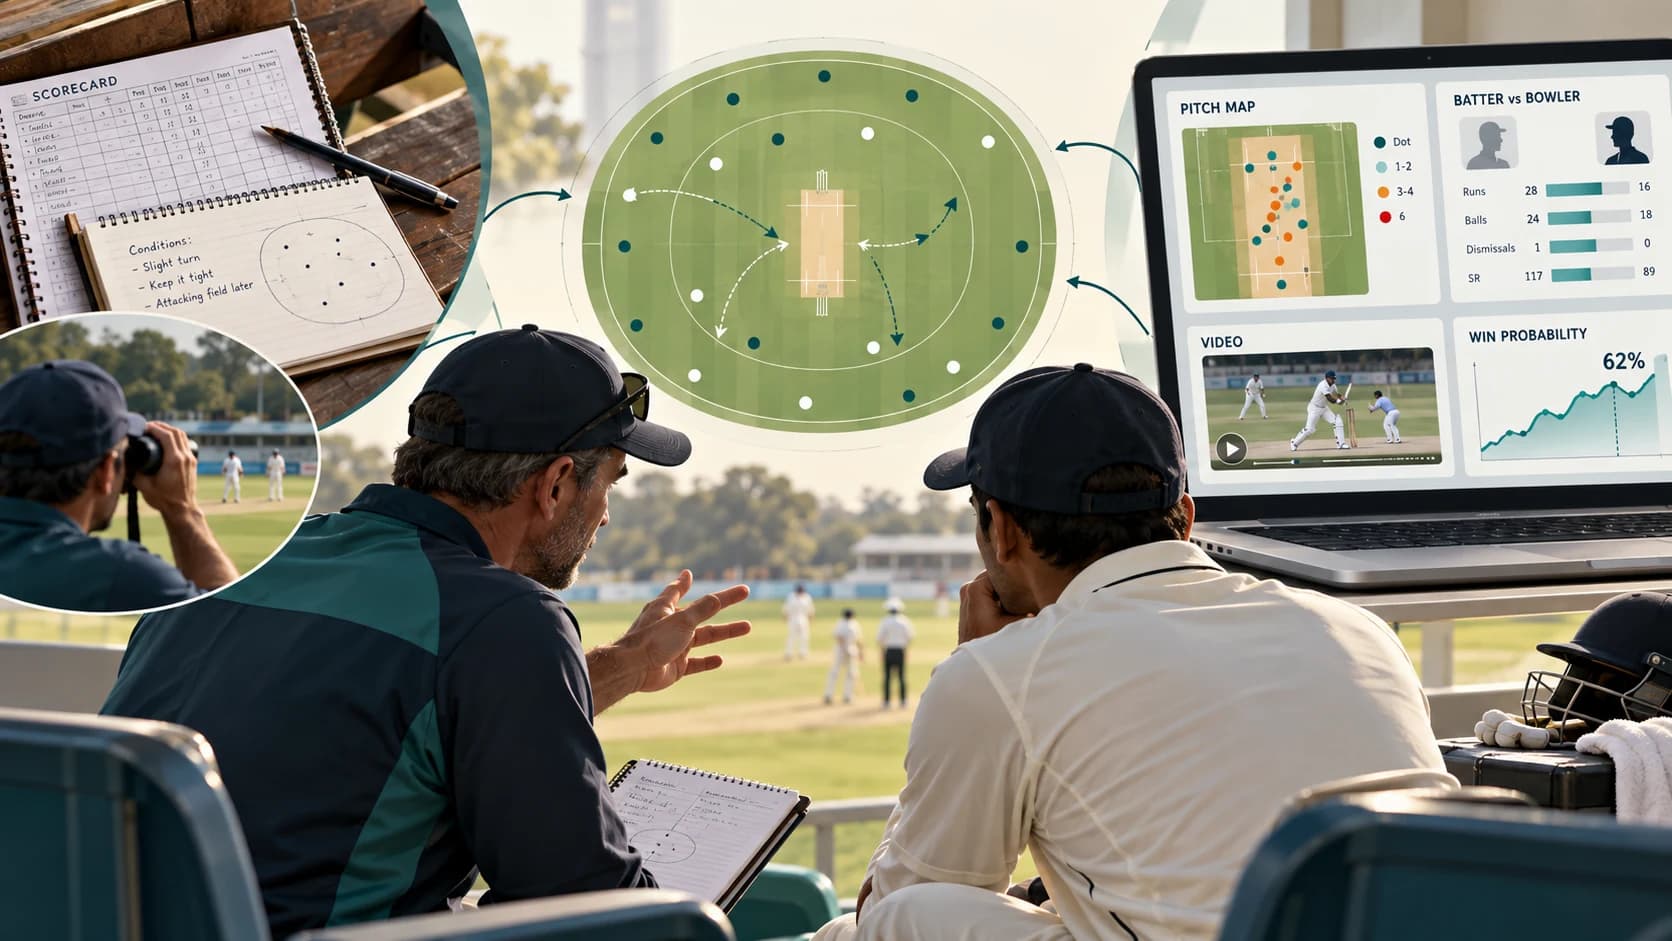
For much of cricket's history, strategy was built mainly from:
- scorecards,
- personal observation,
- coaching experience,
- memory,
- instinct.
A captain might remember that a batter looked uncomfortable against left-arm spin.
A coach might know that a particular ground usually favoured seam bowling.
A selector might judge a player primarily from runs, wickets and averages.
Those things still matter.
What has changed is the amount of evidence available behind them.
Modern cricket teams can now search millions of deliveries and ask extremely specific questions:
How does this batter perform against wrist spin between overs 7 and 15?
Which length produces the most false shots against this opponent?
Should we send a left-hander next because of the bowler currently operating?
Which bowler gives us the best matchup for the next two overs?
How does this player's performance change on slow pitches?
Professional platforms from companies such as CricViz and Stats Perform are built around exactly these kinds of questions. CricViz says its analysts combine data, video and coaching experience to support opposition strategy, squad optimisation, player development and match management. Stats Perform says detailed Opta ball-by-ball data is used to inform selection, matchups and in-game tactics across red-ball and white-ball cricket.
The biggest change is not that cricket suddenly became mathematical.
It is that decisions which were once based mainly on memory can now be checked against a much larger record of what actually happened.
Cricket Has Moved Beyond Runs, Wickets and Averages
Traditional cricket statistics are useful.
A batting average tells us roughly how often a player scores before being dismissed.
A strike rate tells us how quickly the player scores.
A bowling average tells us how many runs a bowler concedes per wicket.
But these numbers compress thousands of different situations into one figure.
Imagine two batters with the same T20 strike rate.
One may dominate pace but struggle badly against spin.
The other may be excellent against spin but weak against short fast bowling.
Their headline statistics are identical.
Their tactical value is not.
Modern databases break performances into much smaller pieces.
CricViz says its database contains detailed data for major cricket and can record up to 30 data points for each ball, including information about the delivery, shot and fielding outcome.
Stats Perform says Opta collects detailed ball-by-ball information from more than five million cricket deliveries each year and uses that data for advanced performance metrics and AI models.
That level of detail lets teams move from:
“How good is this player?”
to:
“How good is this player in the exact situation we expect tomorrow?”
T20 Made Situational Analysis Much More Valuable
Data analytics matters in every format, but T20 accelerated the change.
A T20 innings contains only 120 legal deliveries.
Every over has a clear tactical cost.
Captains and coaches have to decide:
- which bowler takes the new ball,
- who bowls in the powerplay,
- when to use spin,
- which bowler is saved for the death,
- which batter should come in next,
- when to attack,
- when to protect wickets.
Because the game is compressed, a small tactical advantage can matter quickly.
CricViz notes that batter-bowler matchups have become a major part of professional T20 strategy.
Instead of thinking only in terms of:
“Our best bowler should bowl now,”
teams can ask:
“Which available bowler is best suited to this particular batter in this particular phase?”
That is a very different way of thinking.
Matchups Changed How Captains Use Bowlers
Suppose Batter A has these broad tendencies:
- very strong against right-arm off-spin,
- average against pace,
- noticeably weaker against left-arm wrist spin.
The traditional approach might be:
Use the bowler who is having the best day.
A data-informed approach adds another question:
Which bowler creates the hardest matchup for the batter currently on strike?
Professional analysis tools now allow teams to examine batter-versus-bowler combinations using far more context than simple head-to-head averages.
Stats Perform specifically lists matchup analysis as one of the main applications of its cricket performance platform.
CricViz similarly offers tools that break performance down against different opposition strategies and match situations.
This can influence:
- bowling changes,
- over allocation,
- field settings,
- which end a bowler uses,
- when a spinner is introduced.
But the numbers do not automatically make the decision.
A matchup based on 12 previous balls may be too small to trust.
The pitch may suit another bowler better.
The preferred bowler may have only one over left.
Analytics adds evidence to captaincy.
It does not remove captaincy.
Batting Orders Have Become More Flexible
For a long time, batting orders were relatively fixed.
Number 3 usually batted at number 3.
Number 5 usually batted at number 5.
That structure still exists, especially in longer formats.
But white-ball teams increasingly think in terms of roles and matchups.
Imagine a wicket falls and the opposition has two overs of leg-spin coming.
Instead of automatically sending the next batter in the nominal order, a team might send a player who:
- scores faster against leg-spin,
- is left-handed,
- rotates strike better,
- has a favourable historical matchup.
Stats Perform says predictive and matchup tools can inform changes to the batting order as match situations develop.
This is one of the most visible ways analytics has changed tactics.
The question is no longer always:
Who is next?
It can be:
Who is best for the next phase?
Teams Now Analyse Cricket by Phase
A player's overall statistics can hide enormous differences between parts of an innings.
White-ball analysts often separate games into phases such as:
- powerplay,
- middle overs,
- death overs.
A batter who scores at a strike rate of 140 overall might be:
- 165 in the powerplay,
- 115 against middle-over spin,
- 180 at the death.
Those are three different tactical players hidden inside one average.
The same applies to bowlers.
A fast bowler may be expensive overall but outstanding at the death.
A spinner may be extremely economical in middle overs but vulnerable in the powerplay.
By breaking performance into phases, teams can define clearer roles.
That affects:
- selection,
- batting position,
- bowling allocation,
- training.
Analytics has therefore encouraged cricket to think less in terms of generic labels such as:
batter
or
bowler
and more in terms of:
powerplay aggressor
middle-over controller
death hitter
new-ball wicket-taker
death specialist
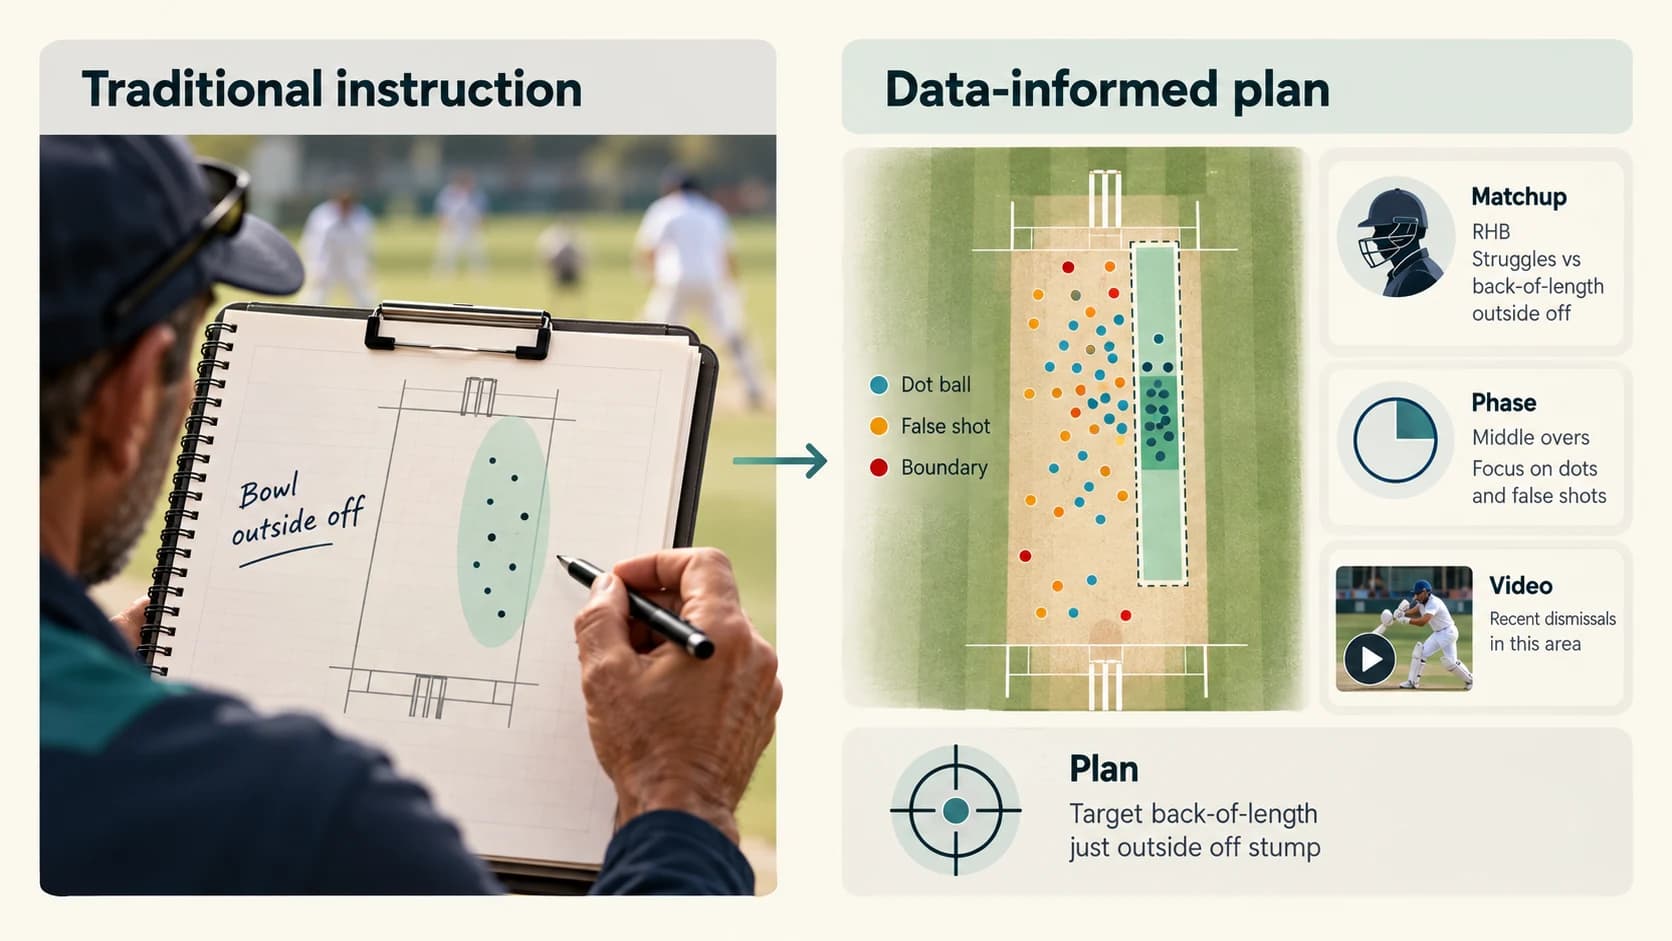
Pitch Maps Made Bowling Plans More Precise
A coach once might tell a fast bowler:
Keep it tight outside off stump.
Modern analysis can make that instruction much more specific.
A pitch map can show exactly where hundreds of previous deliveries landed and what happened afterward.
An analyst can filter the data to ask:
- Where does this batter score most boundaries?
- Which length produces the most false shots?
- Where have wickets come from?
- Which areas produce dot balls?
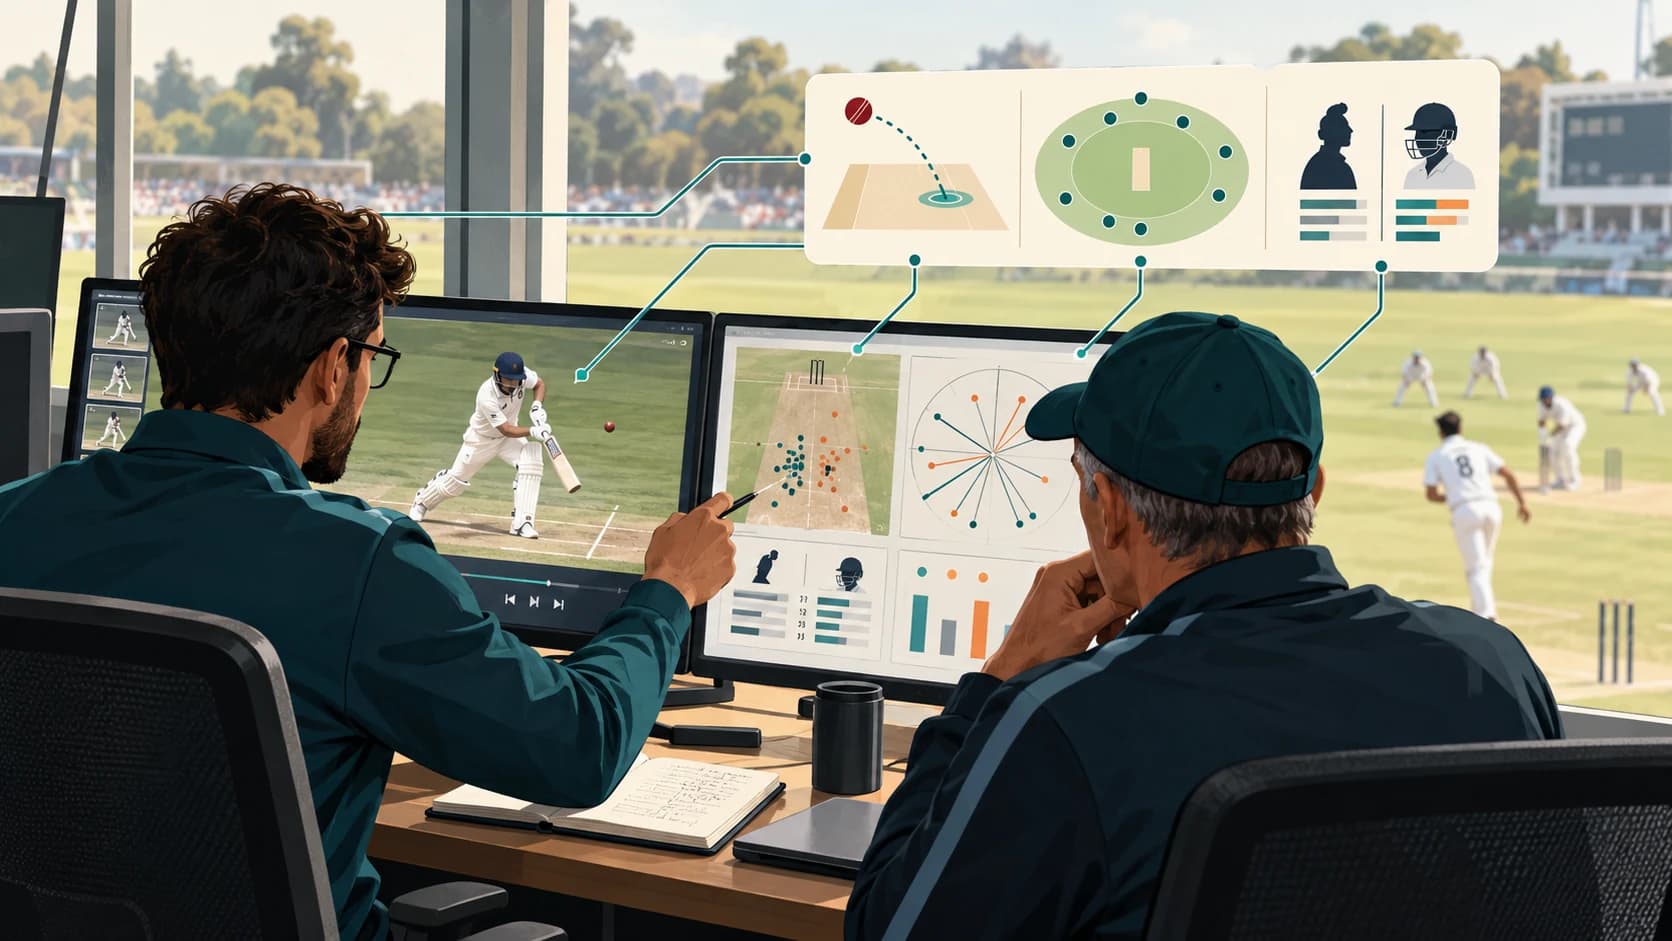
CricViz's Centurion platform integrates data, video and official tracking information from technologies such as Hawk-Eye and Virtual Eye to analyse speed, line and length.
That means a bowling plan can become:
Attack a back-of-a-length corridor just outside off stump.
rather than:
Bowl well.
The difference is important because professional players are already highly skilled.
Tiny changes in length can separate:
- a driveable half-volley,
- a difficult good-length ball,
- a comfortable back-foot shot.
Data helps define those margins.
Field Settings Can Be Built Around Scoring Patterns
Batting data also reveals where players score.
Wagon wheels and shot-location maps can show:
- favourite boundary areas,
- preferred release shots,
- weak scoring zones,
- common aerial shots.
Suppose a batter repeatedly attacks spin through midwicket but rarely scores through extra cover.
A team may:
- protect the leg-side boundary,
- bowl a line that encourages the expected shot,
- place a catching fielder where mistakes are most likely.
The important point is that the field and bowling plan become connected.
A field is not simply arranged because it “looks attacking.”
It can be designed around the shots the bowling strategy is trying to produce.
Video and Data Are Now Linked
One of the most important advances is not a new statistic.
It is the ability to move instantly from the statistic to the video.
Suppose the database says:
Batter X has been dismissed six times against short balls from left-arm pace.
The analyst can retrieve the six clips and watch them.
Now the team can ask:
- Was the batter late?
- Did the dismissals come from hooks?
- Was the ball above shoulder height?
- Were the pitches unusually fast?
- Is there really a repeatable weakness?
CricViz says its Centurion system allows analysts, coaches and players to search ball-by-ball data and retrieve the corresponding video clips within seconds.
This is extremely important because numbers show what happened.
Video can help explain why.
Analytics Has Changed Player Recruitment
Data does not only affect match-day tactics.
It has changed how teams build squads.
Franchise cricket creates a difficult recruitment problem.
Players compete in:
- different countries,
- different leagues,
- different conditions,
- different standards.
A player averaging 40 in one competition may not be equivalent to a player averaging 40 somewhere else.
Analytics allows teams to adjust for context and compare players more systematically.
CricViz says its performance-analysis work supports:
- talent evaluation,
- squad optimisation,
- franchise drafts,
- recruitment.
Its player-rating models also account for factors such as opposition quality and how recent a performance was.
This changes the questions asked at an auction or draft.
Instead of:
Who scored the most runs last season?
a team can ask:
Who provides the specific skill our squad lacks?
That might be:
- a left-handed middle-order spin hitter,
- a powerplay swing bowler,
- a death bowler,
- a high-value boundary fielder.
Analytics encourages role-based recruitment.
Selection Can Be Based on Conditions, Not Reputation Alone
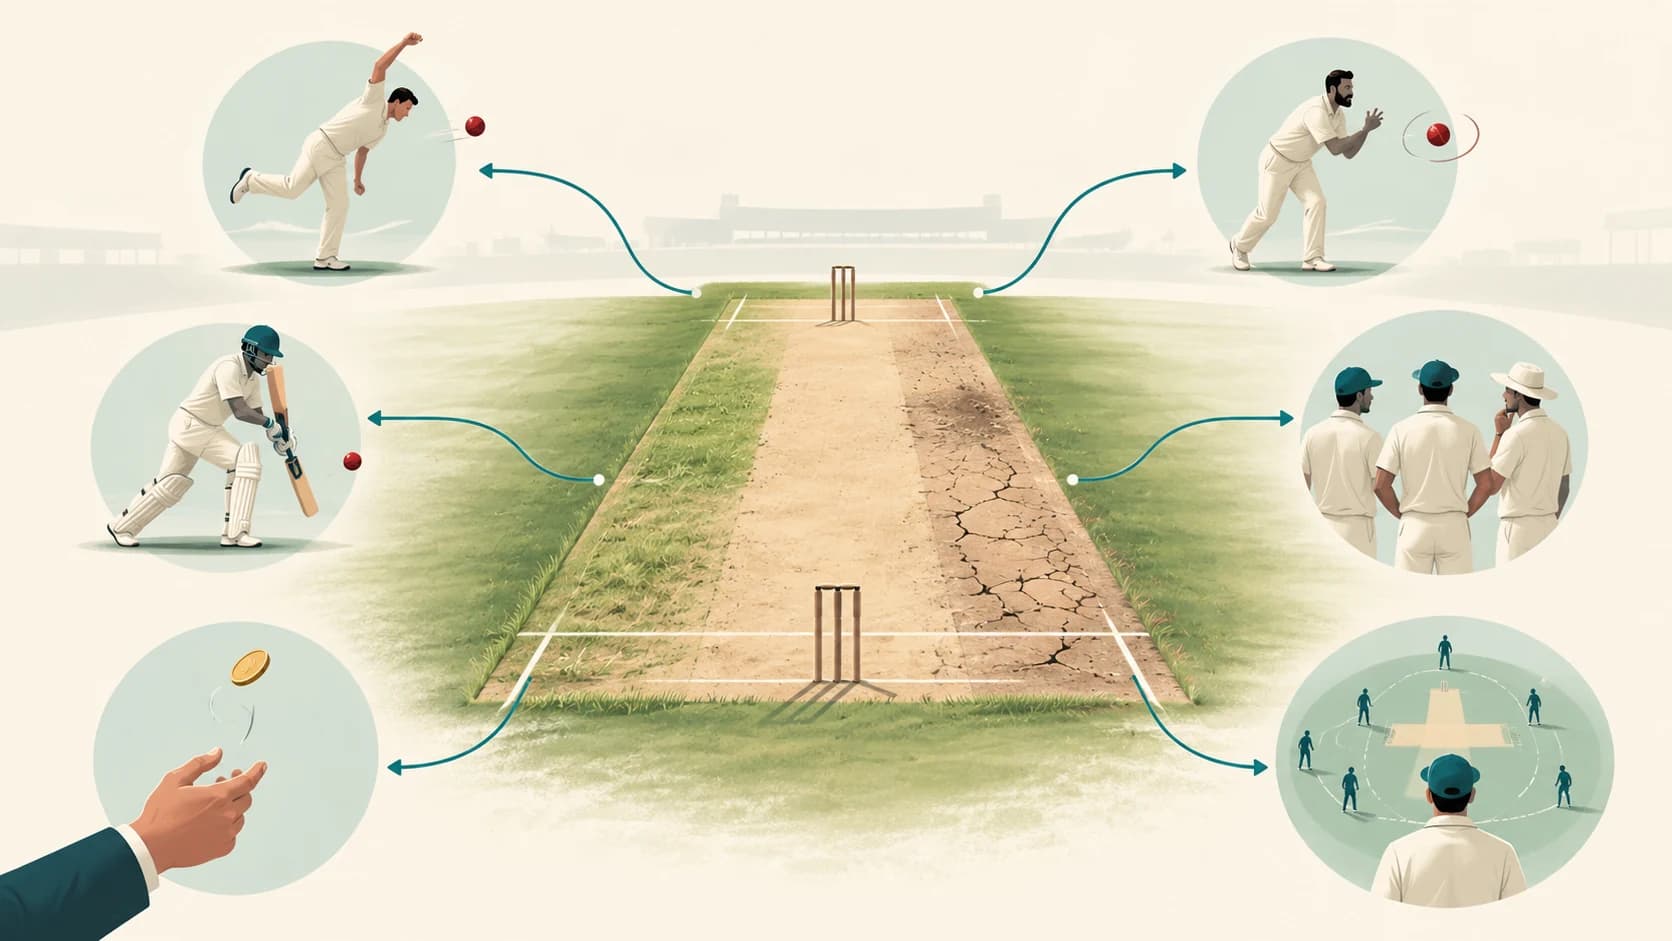
Imagine a Test series moving from a fast, bouncy venue to a slower surface that historically favours spin.
A team's best XI may change.
Stats Perform says its match-analysis tools allow teams to examine:
- historical venue conditions,
- player performance,
- opposition performance,
when informing selection.
A player who is generally considered stronger may not be the better choice for one particular match.
This does not mean selectors blindly follow a model.
But the model can reveal evidence that reputation alone might hide.
Strategy Can Change During the Match
Analytics is no longer only pre-match preparation.
Live data can support decisions as the game changes.
Suppose a team expected the pitch to favour pace.
After ten overs, the data shows:
- slower balls are gripping,
- spin is producing more false shots,
- boundary scoring against pace is unusually easy.
The original plan may need to change.
Stats Perform says Opta event data is collected in real time and can support in-game tactical decisions. Its cricket products also provide models that update after each delivery, including:
- live win probability,
- next-ball prediction,
- team-score projections,
- player-score projections.
CricViz similarly describes match-management tools that provide probability-based decision support for different match situations.
The captain still decides.
But the dressing room can now compare instinct with live evidence.
Win Probability Changed How People Think About Risk
Traditional cricket commentary often describes a team as:
- ahead,
- behind,
- under pressure,
- in control.
Win-probability models turn those ideas into a continuously changing estimate.
CricViz's WinViz uses historical T20 information and current match context to estimate expected outcomes.
Stats Perform's predictive systems likewise update probabilities based on factors including:
- current game state,
- team strength,
- historical matchups,
- venue and conditions.
A win probability is not a prophecy.
But it helps quantify risk.
Suppose a chasing team needs 60 from 30 balls with seven wickets left.
The captain or analyst can compare that position with thousands of similar games.
This helps teams think more clearly about questions such as:
Do we need to attack now?
Can we afford another quiet over?
How damaging would a wicket be at this stage?
Better Metrics Have Changed How Performance Is Judged
Traditional averages do not always tell you whether a player helped the team in context.
Consider two innings:
Player A: 50 from 40 balls
Player B: 32 from 15 balls
Which was better?
The answer depends on:
- pitch difficulty,
- target,
- wickets remaining,
- match phase,
- expected scoring rate.
CricViz's Match Impact model is explicitly designed to evaluate white-ball performance in the context of the game rather than relying only on average and strike rate.
This kind of contextual analysis can change:
- player evaluation,
- selection,
- recruitment,
- post-match review.
The key shift is from:
What number did the player produce?
to:
How valuable was that performance in this situation?
Training Has Become More Targeted
Analytics is most useful when it changes practice.
Suppose analysis shows that a batter:
- scores slowly against high pace,
- struggles against wide yorkers,
- repeatedly gets dismissed pulling balls above chest height.
The coaching staff can design net sessions specifically around those problems.
Likewise, a bowler preparing for an opponent may practise:
- one particular line,
- slower balls to a certain type of batter,
- yorkers from a specific angle.
The process becomes:
data identifies pattern
↓
video confirms it
↓
coach interprets it
↓
training recreates it
↓
player rehearses response
This is one of the most practical changes analytics has made.
Practice can become more closely connected to the actual opponent.
Predictive Models Let Teams Test “What If?” Questions
Modern analytics can also simulate possible futures.
Stats Perform says its OptaAI cricket match simulator can simulate the outcome of each ball thousands of times.
That allows questions such as:
What happens if Batter A goes in next?
What if we save Bowler B for the 18th over?
Which player combination gives us the strongest expected finish?
The model does not discover one guaranteed future.
It compares many possible futures.
This changes analytics from:
describing the past
to:
testing decisions before they happen.
That is one of the biggest conceptual shifts in modern sports strategy.
The Numbers Can Still Mislead
Data analytics is powerful precisely because cricket produces so much information.
But the same abundance creates traps.
Small samples
A batter may have been dismissed three times by a bowler in only 15 deliveries.
That does not automatically prove a genuine weakness.
Context
Statistics from one country may not transfer perfectly to another.
Old data
Players change technique.
Selection bias
A player's numbers may partly reflect the roles in which teams have used them.
Hidden information
A database may not know that a player:
- has a minor injury,
- changed technique recently,
- received new tactical instructions,
- is fatigued.
Good analysts therefore avoid presenting every correlation as a cricket law.
More Data Does Not Mean Less Human Judgement
This is perhaps the most important point.
Analytics has not removed:
- coaches,
- captains,
- selectors,
- scouts,
- player intuition.
In many ways, it has made their judgement more important.
Someone still has to decide:
- which pattern is meaningful,
- which statistic is misleading,
- whether a player can execute the plan,
- whether today's conditions are unusual,
- when to abandon the pre-match strategy.
CricViz describes its performance work as combining data and video with coaching experience.
That combination matters.
A model can say a matchup is favourable.
A captain may see that the bowler has lost control.
The model does not stand at mid-off.
The Best Analytics Often Produces the Simplest Plan
A professional analyst may begin with:
- millions of deliveries,
- hundreds of filters,
- pitch maps,
- wagon wheels,
- video,
- predictive models,
- matchup statistics.
The player should not necessarily receive all of it.
The final message might be:
To a bowler
Good length outside off. Do not overpitch. Use the bouncer after two dots.
To a batter
Spinner is most dangerous early in the over. Rotate first, attack later.
To a captain
Use the left-arm spinner while these two right-handers are together.
That compression is what makes analytics useful.
The goal is not to produce the largest report.
It is to create the clearest decision.
Data Has Changed Cricket From Memory-Based to Searchable Strategy
The deepest change is easy to miss.
For most of cricket's history, a team's collective memory was limited.
Coaches could remember only so much.
Players saw only the matches they watched or played.
Now the database remembers almost everything that has been recorded.
A team can search:
every major delivery
↓
filter to:
one opponent
↓
then:
one bowling style
↓
then:
one phase
↓
then:
one line and length
↓
then retrieve:
the statistics and video.
That does not eliminate uncertainty.
The bowler can miss the plan.
The batter can improvise.
The pitch can behave unexpectedly.
The opposition can adapt.
But teams no longer have to rely on memory alone.
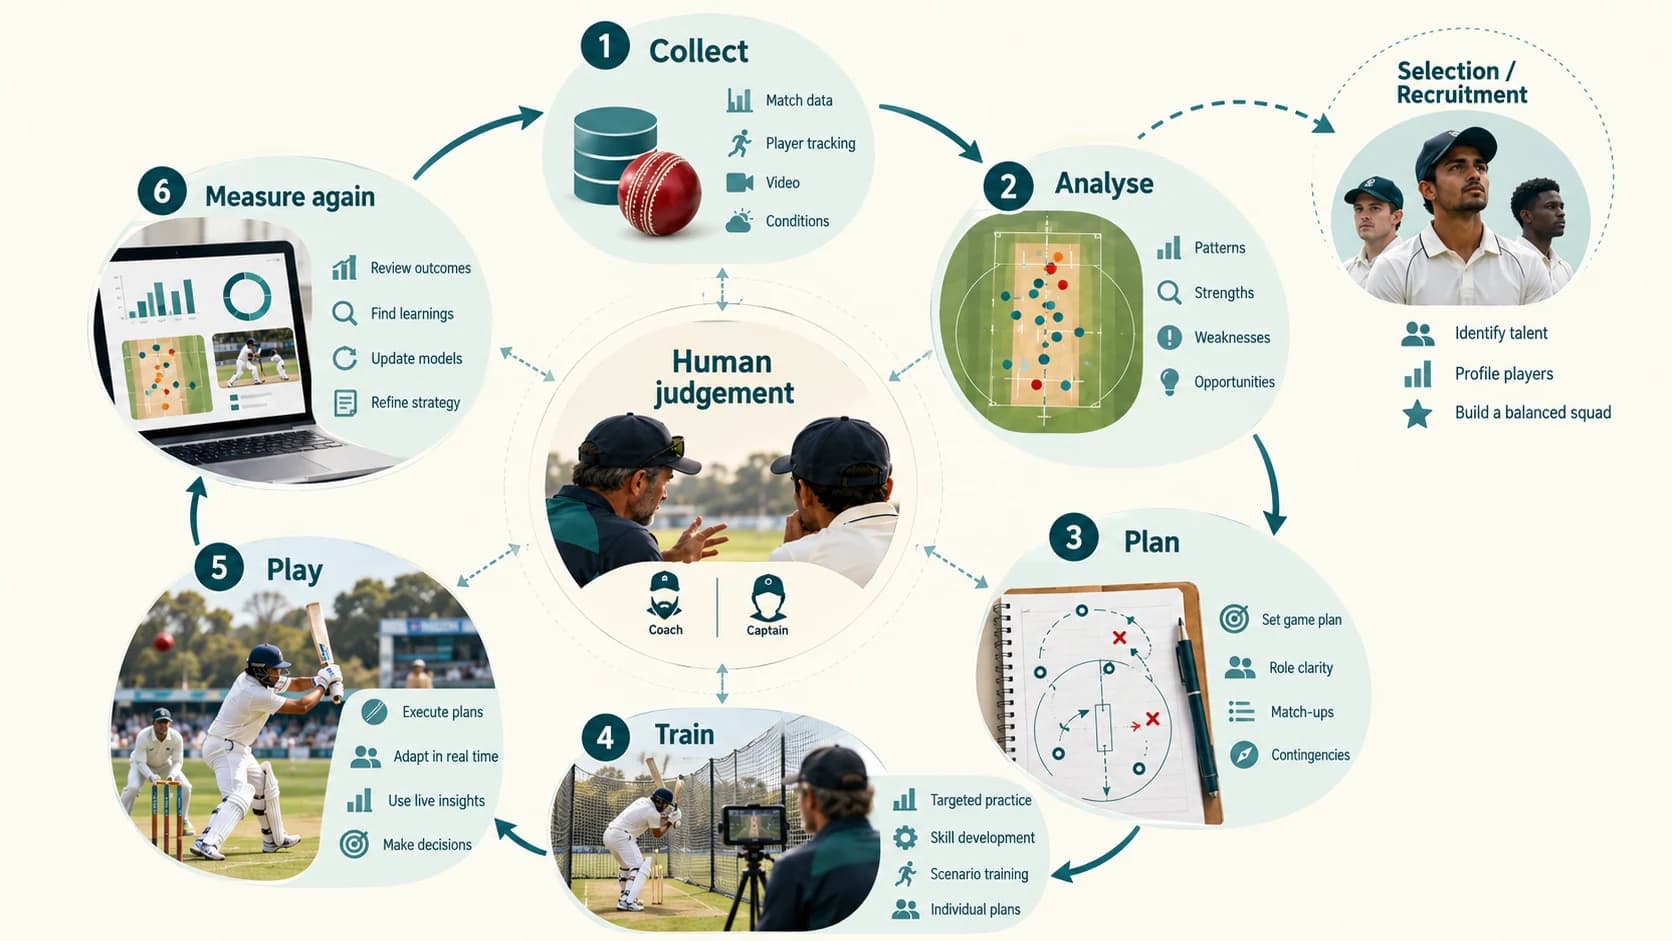
Modern cricket strategy increasingly follows a cycle:
collect
↓
analyse
↓
plan
↓
train
↓
play
↓
measure again
That is how data analytics has changed cricket.
Not by turning the game into a spreadsheet.
But by giving players, coaches and captains a much larger evidence base from which to make their very human decisions.