
GDP, GVA, National Income and Economic Growth
GDP, GVA, National Income and Economic Growth. A detailed chapter in Indian Economy, Fiscal Policy & External Sector, with explanations and examples for Indian banking examinations.
By Akhilesh Saini · Reviewed 8 Oct 2026
Importance: VERY HIGH
Prerequisite: Basic economic ideas from BA-01
Learning focus: Output, income, growth, statistical measurement and banking implications.
1. Why do we measure an economy?
Imagine a village with farms, a dairy, a repair shop and a small hospital. Each provides something valuable. Now imagine a country containing millions of similar producers. Policymakers need to know whether the combined economic activity is increasing, whether production is rising in real terms and how broadly prosperity is shared.
That is why national accounts exist. They convert countless transactions into a coherent picture of production, income and spending during a defined period.
A key caution: national accounts measure economic activity; they are not a perfect measure of happiness, environmental quality or welfare.
2. Gross Domestic Product — GDP
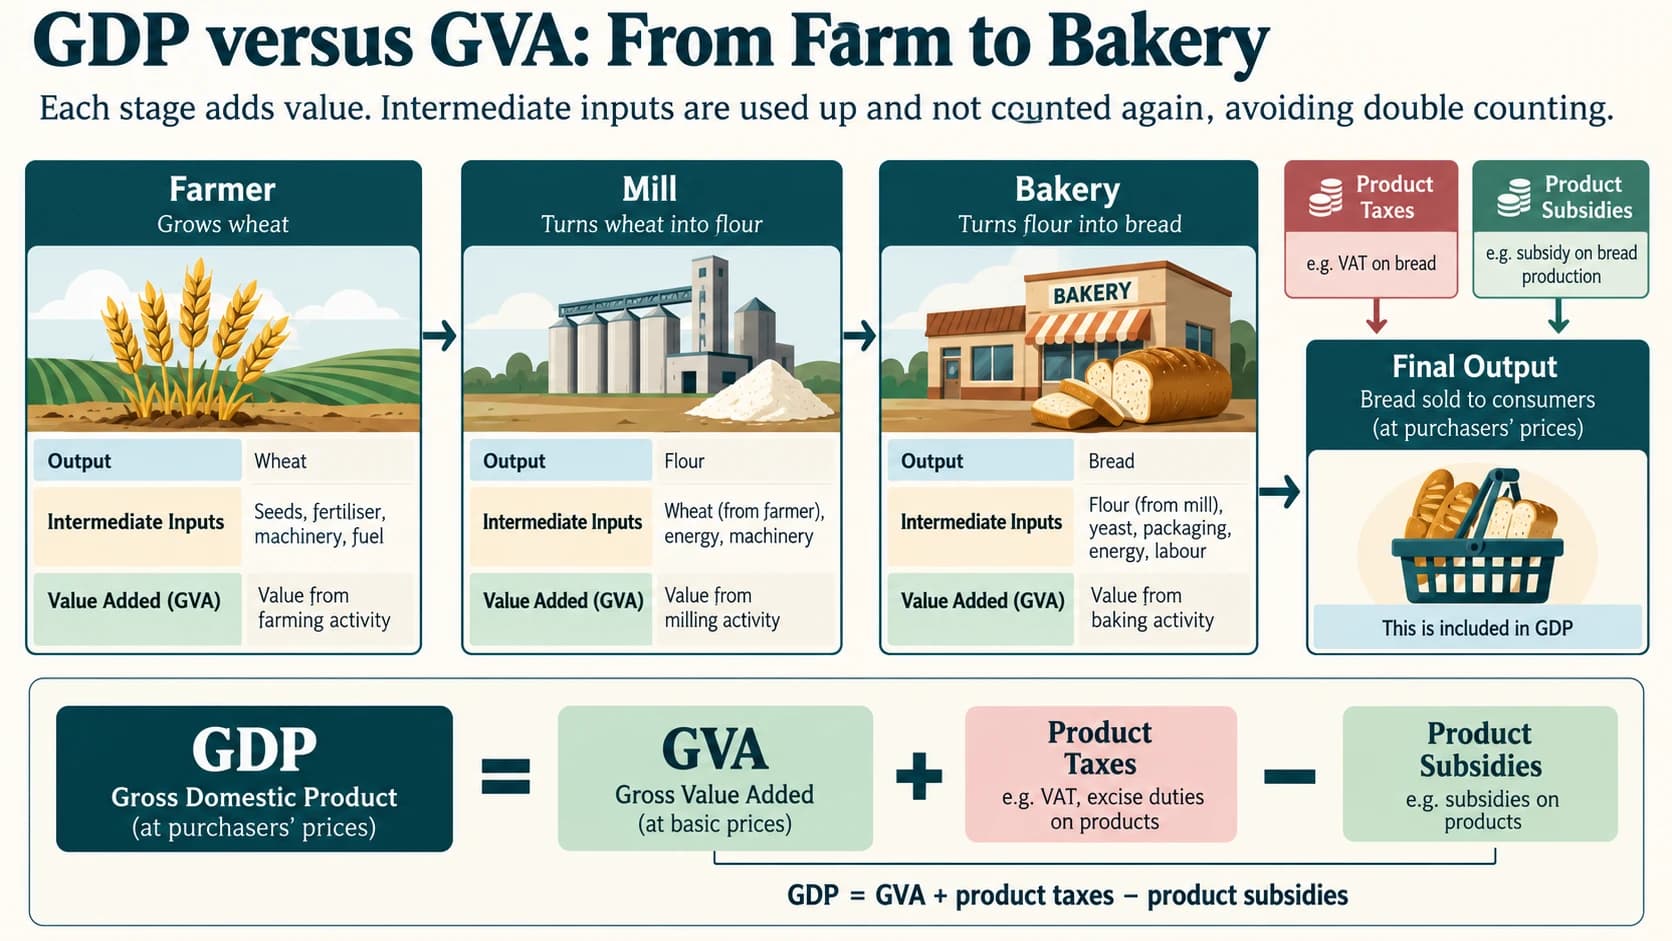
GDP is the monetary value of final goods and services produced within an economy's economic territory over a given period. 'Domestic' is about the place of production, not the nationality of the producer. 'Gross' means depreciation has not been deducted. 'Final' prevents counting intermediate inputs again and again.
Examples of final production include a new motorcycle sold to a household, an education service delivered to a student and the value added by a bakery producing bread. A second-hand motorcycle resale mostly transfers ownership of an existing asset; it is not counted as newly produced motorcycle output, although a current brokerage or repair service can be counted.
The double-counting trap
A farmer sells wheat for ₹100; a mill sells flour made from that wheat for ₹150; a bakery sells bread for ₹250. If those are the successive prices of a single production chain, adding 100 + 150 + 250 incorrectly gives ₹500. The final bread is worth ₹250, which equals the total value added:
| Stage | Sale value | Intermediate input | Value added |
|---|---|---|---|
| Farmer | ₹100 | ₹0 | ₹100 |
| Mill | ₹150 | ₹100 | ₹50 |
| Bakery | ₹250 | ₹150 | ₹100 |
| Total value added | — | — | ₹250 |
Illustrative example, not official GDP data. This is why GDP is based on final output or on the sum of value added, rather than every sale.
3. Gross Value Added — GVA
GVA measures output minus intermediate consumption at the producing-unit or sector level. In India's national accounts, GVA is generally presented at basic prices, while GDP is presented at market prices.
GDP at market prices = GVA at basic prices + taxes on products − subsidies on products.
Suppose GVA is ₹900, taxes on products are ₹120 and subsidies on products are ₹20. GDP at market prices = ₹900 + ₹120 − ₹20 = ₹1,000. These are fictional units for learning.
This relationship helps answer two different questions:
- GVA: how much new value was generated by producing sectors?
- GDP: what is the market-price measure of final domestic production after the net effect of product taxes and subsidies?
Do not claim the two are always equal, or confuse 'taxes on products' with all Government tax revenues.
4. Three ways of measuring GDP
Production or value-added approach
Add GVA across industries and then adjust for taxes less subsidies on products. This is useful when analysing sectors such as agriculture, manufacturing and services.
Expenditure approach
A familiar identity is GDP = C + I + G + (X − M), with components interpreted consistently:
- C: private final consumption expenditure;
- I: gross domestic capital formation/investment (including changes in inventories in fuller formulations);
- G: Government final consumption expenditure;
- X − M: exports less imports of goods and services.
An imported phone consumed in India contributes to C, but the import adjustment in M prevents treating all of its foreign-produced value as Indian domestic output. This is a common exam conceptual question.
Income approach
Sum incomes generated by domestic production, appropriately adjusted for production taxes/subsidies and accounting conventions. These include employee compensation, operating surplus and mixed income. It does not simply add all bank deposits, all savings or financial transfers.
The three approaches are different views of the same economy; in actual statistics there may be measurement differences.
5. Nominal GDP and real GDP
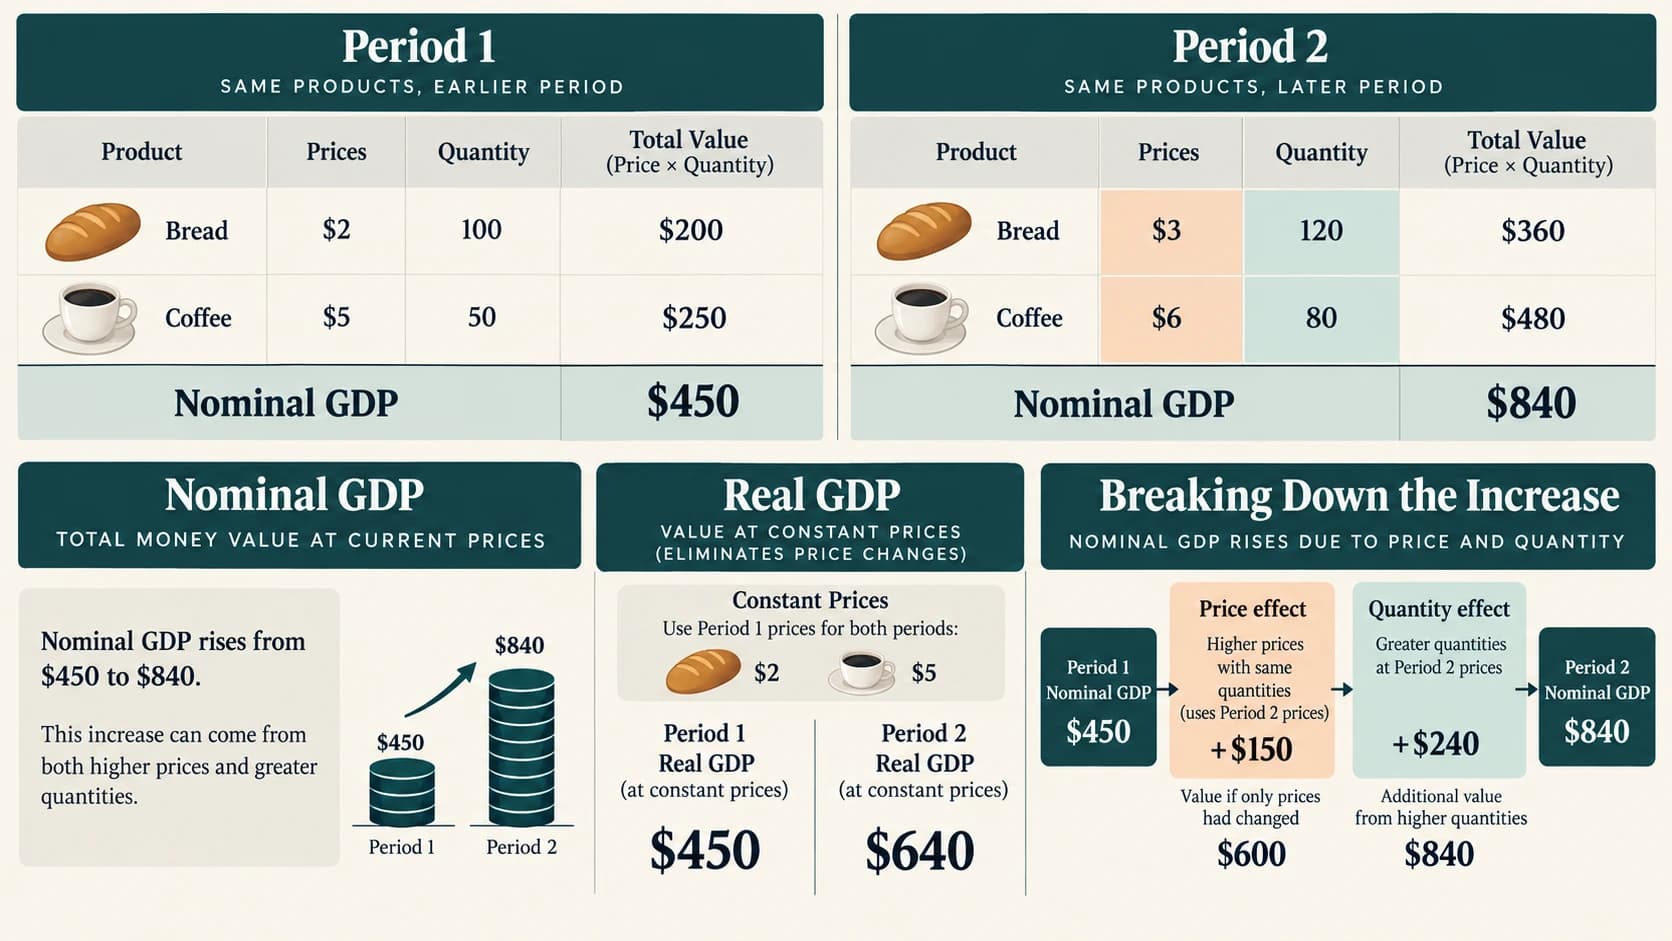
Nominal GDP values output at prices of the period being measured; it can increase because quantities rise, prices rise, or both. Real GDP values output at reference-period prices so that volume changes are more visible. India publishes estimates at current and constant prices.
Consider an economy producing only notebooks:
| Year | Quantity | Price | Nominal value |
|---|---|---|---|
| A | 100 | ₹20 | ₹2,000 |
| B | 110 | ₹25 | ₹2,750 |
Nominal value increased 37.5%, but actual notebook production increased 10%. At Year A prices, Year B production would be ₹2,200: real volume growth is 10%, not 37.5%.
Nominal growth and real growth are therefore not interchangeable.
6. GDP growth rates
A basic year-on-year growth formula is:
Growth (%) = [(GDP in current period − GDP in comparable earlier period) / GDP in earlier period] × 100
For example, real GDP rises from ₹200 to ₹216 (same constant-price series): growth = 8%. If the published series or base year has been revised, both periods must be comparable.
Quarterly growth and seasonal effects
India publishes quarterly GDP estimates. Analysts often compare the quarter with the corresponding quarter of the previous year, not simply with the preceding quarter, because agriculture, festivals, monsoons and Government spending patterns can be seasonal. A quarter-on-quarter comparison requires appropriate treatment for seasonality.
Estimated, revised and final readings
Early GDP numbers are estimates and can change when more complete data arrive. A provisional or advance estimate is not a mathematical error merely because it is later revised. Always identify the release vintage when citing a growth number.
7. Base year and statistical revisions
A base/reference year supports a constant-price series. It is revised to reflect changing economic structure, improved source data, consumption patterns and measurement methods.
India's national accounts shifted to a 2022–23 base-year series in 2026. The durable principle is that a new base series may revise both GDP levels and growth rates; it does not mean the economy suddenly produced more solely because statisticians changed the base. Older exam guides may use 2011–12, but that is no longer the current series base in this version of the module.
8. GDP, NDP, GNI and NNI
- GDP: gross domestic production; includes depreciation.
- NDP: net domestic product = GDP − consumption of fixed capital/depreciation.
- GNI: gross national income = GDP + net primary income from the rest of the world.
- NNI: net national income = GNI − depreciation.
Historically many Indian examination questions use national income as shorthand for NNI at factor cost in older textbook terminology. Modern national accounts use updated classifications; when answering, inspect the precise definition in the question rather than assuming every indicator labelled 'national income' uses one unchanged valuation basis.
Domestic versus national: an example
An Indian company producing goods in another country contributes to that country's domestic product. Income accruing to Indian residents from abroad may enter India's national income through the relevant net primary-income adjustment. Remittances sent by a migrant worker are not automatically identical to GDP production in India.
9. Per capita income and standards of living
Per capita GDP = GDP ÷ population; similar per capita concepts can be calculated for GNI/NNI. Per capita measures are averages, not a statement that every person earns the same amount. They mask inequality and differences in purchasing power.
A rise in per capita income can coexist with unemployment, pollution or regional disparities. Use human-development, health, education, employment and distribution indicators alongside output to assess development.
10. Economic growth versus economic development
- Growth: increase in an economy's real output over time.
- Development: broader improvement in productive capability, living conditions, opportunity and welfare.
- Inclusive growth: benefits and opportunities reaching different groups, places and income levels.
- Sustainable growth: output expansion compatible with longer-term environmental and resource constraints.
A new industrial corridor may increase output, but long-term development also depends on workers' skills, public health, transport and institutional quality.
11. Agriculture, industry and services
Common sectoral classifications are:
- Primary: agriculture, forestry, fishing, mining-related production (exact statistical groupings vary).
- Secondary: manufacturing, construction and related industrial activity.
- Tertiary: trade, transport, finance, information and other services.
The sector with the largest employment share need not have the largest GVA share. Productivity differences matter. Banking supports all three sectors through loans, deposits, payments, trade finance and financial infrastructure.
12. Growth drivers and productivity
Long-run real GDP growth can reflect:
- more workers or labour hours;
- more productive capital such as factories and equipment;
- better technology and organisation;
- improved infrastructure, education and institutions;
- efficient allocation of resources.
Productivity means achieving more output from a given set of inputs. Growth driven solely by extra spending without corresponding productive capacity can create inflationary pressure.
13. Why GDP matters to banking examinations
Higher real growth may increase demand for housing, business and working-capital credit. Slower growth can weaken borrowers' revenues and debt-servicing ability. Nominal growth affects tax receipts and nominal cash flows; inflation affects whether apparently rising sales reflect genuinely greater output. RBI and commercial banks therefore read growth together with inflation, credit, fiscal conditions and external indicators.
Practical banking scenario
A bank compares two manufacturing borrowers. Company A reports sales growth of 12%, while selling prices rose 10%. Company B reports sales growth of 8% with almost unchanged selling prices. The first company's nominal growth tells you less about increased quantity than it initially appears. A banker checks volumes, costs, margins, inventories and cash flow—not GDP alone—to assess creditworthiness.
14. Common confusions
| Confusion | Correct interpretation |
|---|---|
| GDP and GVA are identical | GDP at market prices includes net product taxes relative to GVA at basic prices. |
| Every resale adds to GDP | Existing assets do not represent new production; current associated services may. |
| Nominal growth equals real growth | Nominal growth contains price and volume effects. |
| A larger GDP automatically means richer citizens | Population and distribution matter. |
| GDP counts all work and welfare perfectly | It omits or imperfectly measures important non-market and welfare dimensions. |
| A statistical base revision is a policy rate cut | Base revision changes measurement; it does not directly change interest rates. |
| National production is the same as domestic production | National income adjusts for net income from abroad. |
15. Worked numerical questions
Example A — GDP from GVA: GVA ₹500, product taxes ₹65, product subsidies ₹15 → GDP ₹550.
Example B — Real growth: Constant-price GDP rises from ₹800 to ₹856 → growth 7%.
Example C — NDP: GDP ₹1,000; depreciation ₹80 → NDP ₹920.
Example D — GNI: GDP ₹1,200 and net primary income from abroad is −₹25 → GNI ₹1,175.
Example E — Consumption identity: C ₹600 + I ₹220 + G ₹170 + X ₹90 − M ₹80 = GDP ₹1,000. All quantities are illustrative and assumed comparable.
Quick check — BA-16-01
- Why are intermediate goods not added again to GDP? To avoid double counting.
- What adjustment connects GVA to GDP? Taxes on products minus subsidies on products.
- Can nominal GDP rise when real output is unchanged? Yes, through higher prices.
- Does higher per capita GDP guarantee equal incomes? No.
- What does 'gross' mean? Depreciation has not yet been deducted.
- Can a GDP base revision change previously published estimates? Yes.
Lesson recap: GDP measures domestic final production; GVA isolates the value created in production; real GDP helps isolate output growth; national income adjusts for income from abroad; and neither GDP nor its growth rate alone describes complete economic well-being.