
Inflation and Price Indices
Inflation and Price Indices. A detailed chapter in Indian Economy, Fiscal Policy & External Sector, with explanations and examples for Indian banking examinations.
By Akhilesh Saini · Reviewed 8 Oct 2026
Importance: VERY HIGH
Prerequisite: BA-16-01, and the monetary-policy basics from BA-04.
Learning focus: Price changes, statistical measurement, causes and effects of inflation.
1. What is inflation?
Inflation is a sustained rise in the general level of prices of goods and services over time. It means a unit of currency generally purchases fewer goods and services than before. Inflation is not the same as a single expensive product, and a one-off jump in the price of onions is not automatically general inflation.
Suppose a household's representative shopping basket costs ₹1,000 in one year and ₹1,060 in the next. Basket inflation is 6%. If the same basket later costs ₹1,080, inflation is still positive, but the rate of increase has slowed. This distinction between the price level and the inflation rate is crucial.
2. Inflation rate versus price level
The price index describes the level of prices relative to a reference period. The inflation rate is a percentage change in that index between comparable dates:
Inflation (%) = [(Index now / Index in comparison period) − 1] × 100
If the CPI was 120 a year ago and is 126 now, annual CPI inflation = 5%. If CPI later moves from 126 to 128, prices have still increased even though the corresponding inflation rate may be lower.
Disinflation and deflation
- Disinflation: prices continue rising, but at a slower rate; e.g., inflation falls from 7% to 4%.
- Deflation: the general price level falls, so the inflation rate is negative.
- Reflation: deliberate or observed recovery in prices/economic activity from unusually weak or deflationary conditions.
- Stagflation: weak/stagnant activity alongside high inflation; a difficult policy combination.
A bank exam may ask whether 4% inflation means goods became cheaper than during 7% inflation. No—prices may still be higher; their rate of increase has slowed.
3. Why use a price index?
Millions of items have different price changes. A price index combines selected products and services using a representative basket and weights. A household spending a large share on food feels food-price movements more than changes in an item rarely purchased. Index weights approximate that structure.
An index with base 100 is not an inflation rate of 100%. It merely sets the reference-period level to 100. If the index later reaches 115, the representative measured price level is 15% above its base-period level, not necessarily 15% above the preceding year.
4. Consumer Price Index — CPI
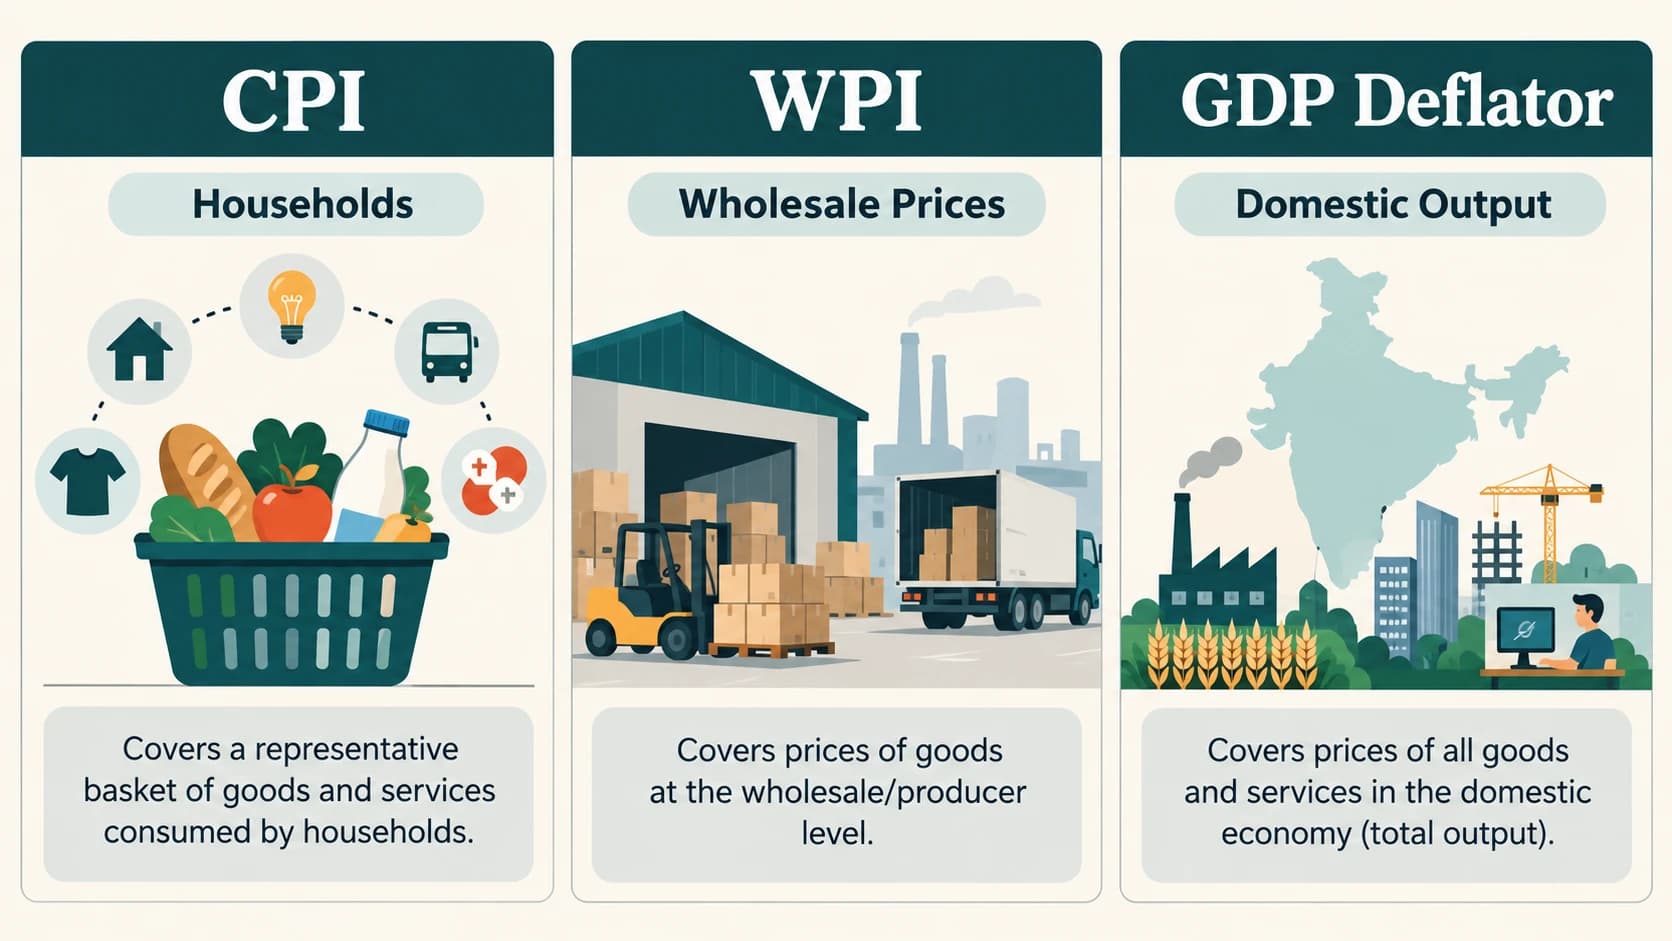
CPI measures price movements for selected goods and services households buy for consumption at the consumer/retail level. In India it is published by the National Statistical Office under MoSPI and includes rural, urban and combined indices. CPI is especially relevant to household purchasing power and inflation-policy analysis.
The CPI basket can cover categories such as food, housing-related services, clothing, health, education and transport, subject to the current official classification and weighting system. Do not memorize category labels from old exam guides without checking the revised framework.
The current official CPI reference year is 2024=100, replacing the older 2012=100 series beginning with the January 2026 release.
Example — CPI basket calculation
Imagine only two categories. Food receives a 60% weight and rises in price by 10%; services receive 40% and rise by 2%. A simplified weighted average suggests inflation of 6.8% (0.6×10 + 0.4×2). Official CPI compilation uses a more detailed method, so this is a teaching illustration, not a reproduction of the NSO formula.
5. Wholesale Price Index — WPI
WPI tracks prices at the wholesale/producer-facing level for a defined goods basket. It is compiled under the Office of the Economic Adviser (DPIIT, Ministry of Commerce & Industry). It is not identical to retail consumer inflation; their baskets, weights, price collection and coverage differ. Traditional WPI coverage focused on goods rather than the full range of consumer services.
The new WPI series uses 2022–23=100, replacing the old 2011–12 base. Official releases also discuss accompanying producer-price indices under the newer statistical framework. Never assume that all price series share the same base year or weighting system.
6. CPI versus WPI versus the GDP deflator
| Indicator | What it primarily tracks | Key exam distinction |
|---|---|---|
| CPI | Prices of selected household consumption goods and services | Retail household inflation and purchasing power |
| WPI | Prices of selected wholesale goods | Wholesale-stage price trends, different basket from CPI |
| GDP deflator | Ratio of nominal to real GDP for domestically produced output | Broad output-price indicator; not a fixed household basket |
| Producer Price Index (where available) | Output/input prices from the producer perspective | Different price concept and methodology from CPI |
A GDP deflator can be expressed as (Nominal GDP / Real GDP) × 100 when both are on a consistent basis. Imports purchased by households may influence CPI, but imported production is not itself part of domestic GDP. Consequently CPI and GDP deflator can move differently.
GDP deflator worked example
Nominal GDP = ₹1,260 and real GDP = ₹1,200 in comparable units. Deflator = 105 (with reference-period 100). That does not necessarily mean current annual inflation is 5%; the deflator level and its annual rate of change are separate concepts.
7. Year-on-year and month-on-month inflation
Year-on-year (YoY) compares the same month in adjacent years; month-on-month (MoM) compares consecutive months. A large seasonal swing can affect MoM even when YoY is modest. Market headlines often quote YoY CPI inflation, but students must read the label.
The base effect
Inflation can look lower because the corresponding previous-year index was unusually high. For example:
- January A: 100;
- January B: 110 → annual inflation 10%;
- January C: 115.5 → annual inflation 5%.
The price level increased in both periods. The lower second rate partly reflects the already higher comparison base. Always ask what changed in both the numerator and denominator.
8. Headline, core and food inflation
Headline inflation is the overall published index's rate of increase. Core inflation often refers to a derived CPI measure excluding volatile components such as food and fuel, depending on the institution's definition. Core is useful for understanding persistent underlying price pressure, but there is no universal guarantee that every published 'core' measure uses identical exclusions.
Food inflation can be driven by rainfall, crop supplies, storage, transport and demand. In India, food-price changes particularly affect household purchasing power, so they matter to both welfare and monetary-policy analysis.
9. Demand-pull inflation
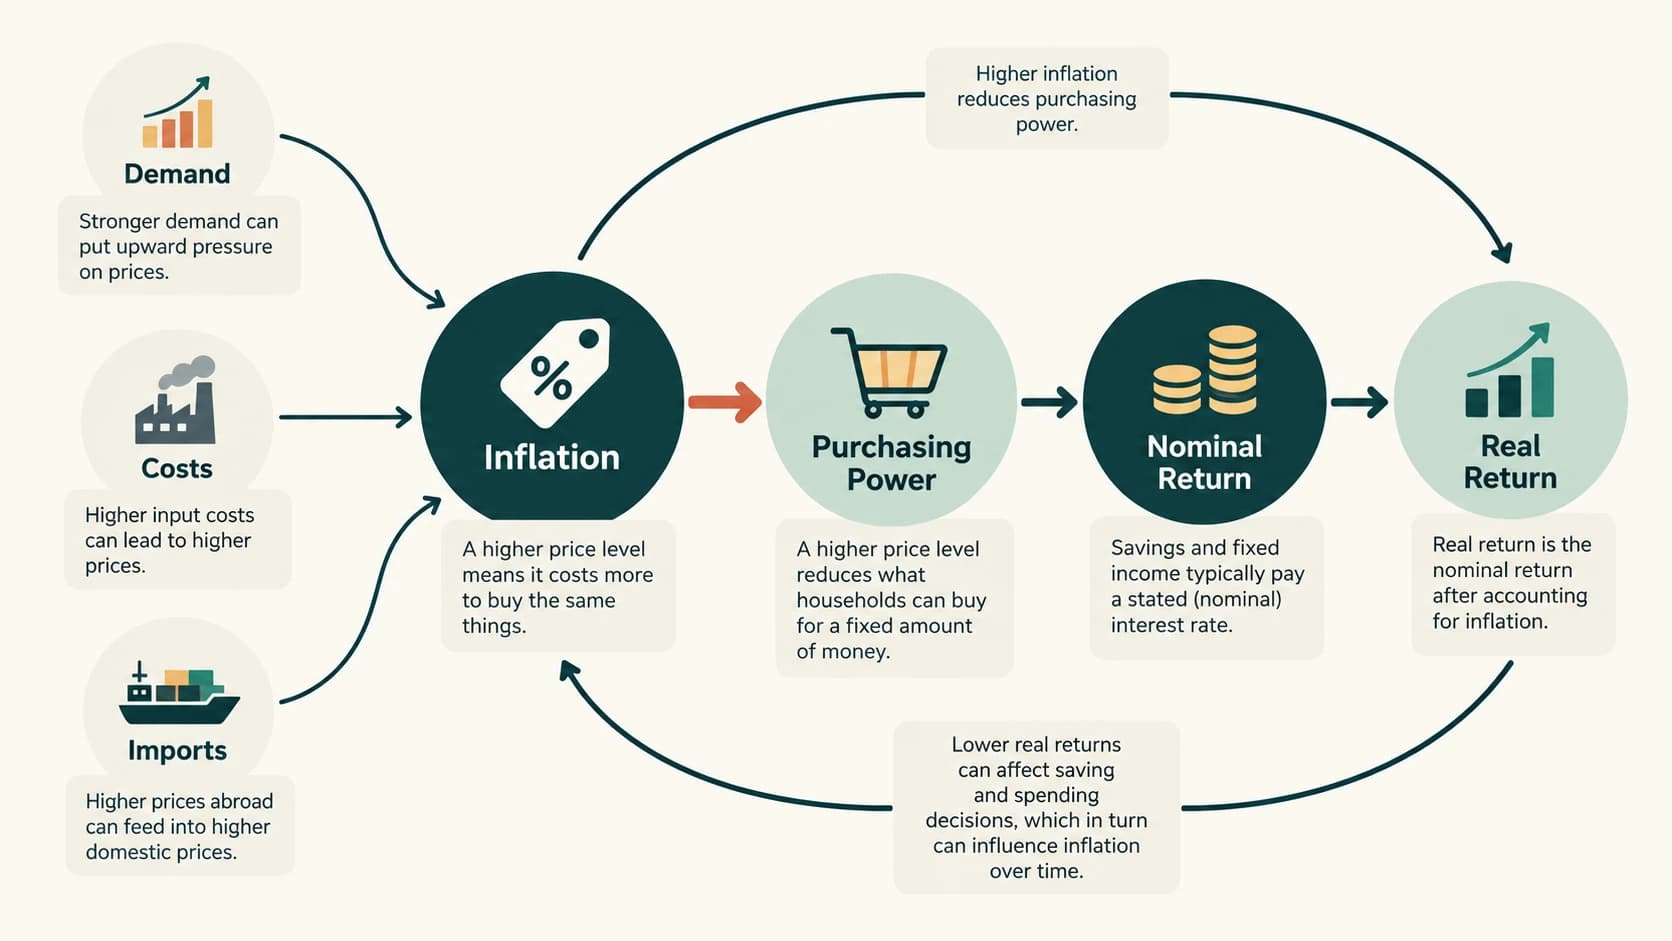
Demand-pull inflation arises when aggregate demand grows faster than an economy's capacity to supply goods and services at existing prices.
Illustration: businesses and households order more construction materials while mines, trucks and plants cannot expand output quickly. Strong spending bids up limited supply. Monetary and fiscal stimulus can affect demand, although the full outcome depends on capacity and circumstances.
10. Cost-push inflation
Cost-push inflation begins with higher production or distribution costs:
- fuel or electricity becomes expensive;
- raw materials cost more;
- supply chains are disrupted;
- wages rise without offsetting productivity gains.
Producers may absorb some of the cost through lower margins, or pass it on to customers. How much is passed on depends on competition and demand. This need not be a uniform rise across every product.
11. Imported inflation and exchange rates
If world crude-oil prices rise, imported fuel and freight costs may increase even without a change in domestic demand. Likewise, rupee depreciation can make dollar-priced imports costlier in rupees, other things equal. The strength and timing of pass-through vary across products and policy arrangements.
Imported inflation links this lesson to BA-16-05 on trade and exchange rates.
12. Inflation expectations and persistence
People make decisions using expected future inflation. Workers seek wage increases, firms set prices, and depositors compare nominal returns to anticipated inflation. Expectations can reinforce price dynamics. A stable and credible monetary framework attempts to keep expectations reasonably anchored.
Not every price increase is permanent. A temporary supply shock can fade; a broad wage-price spiral may persist. Policymakers examine the breadth, duration and causes of inflation rather than one headline figure in isolation.
13. Inflation and bank customers
Savers
A fixed deposit paying a nominal 6% return with inflation of 5% produces an approximate real return of 1%; the exact Fisher adjustment is (1.06 / 1.05) − 1 ≈ 0.95% before taxes. Nominal interest is not the same as real purchasing-power gain.
Borrowers
Inflation can reduce the real burden of a fixed nominal debt, but borrowers may face higher future interest rates or living costs. If the loan is floating-rate, higher policy/benchmark rates can raise payments.
Banks
Inflation can affect loan demand, deposit pricing, bond values, credit quality and customers' expenses. Banks must assess both the inflation level and the RBI's reaction to persistent inflation.
14. Inflation and RBI monetary policy
RBI's monetary-policy framework aims at price stability while keeping growth in mind, within its statutory remit. The concept is stable: by influencing short-term interest rates and financial conditions, monetary policy affects demand and price pressure with lags.
Inflation produced mainly by crop damage or an oil-price shock may not respond immediately to interest-rate changes. Structural supply measures and appropriate fiscal actions may also be relevant.
15. Inflation versus changes in real income
If wages rise by 7% and prices rise by 5%, purchasing power rises by approximately 2%, not 7%. If wages rise by 3% while prices rise by 6%, purchasing power falls even though the nominal salary has increased. Banking-exam word problems often test exactly this relationship.
16. Inflation and bonds
Higher expected inflation can place upward pressure on nominal yields demanded by bond investors. For existing fixed-coupon bonds, a rise in market yields ordinarily lowers market prices. This reinforces the bond-pricing concepts from BA-15. Do not confuse an unchanged coupon rate with an unchanged current yield.
17. Inflation and economic growth: no one-line rule
Very low or very high inflation can create challenges. Moderate predictable inflation may coexist with growth, while volatile inflation complicates investment decisions. A statement that 'inflation always means growth' or 'inflation always means recession' is too simplistic.
18. Common mistakes
| Misconception | Correction |
|---|---|
| Inflation of 4% means prices have fallen | Prices generally rose by 4% over the comparison period. |
| Disinflation means negative inflation | It means a lower positive rate if inflation remains above zero. |
| CPI and WPI measure the same basket | Their price stages and coverage differ. |
| Index value 110 means inflation is exactly 10% this month | Depends on the comparison reference. |
| A high WPI automatically means identical CPI inflation | Price changes are transmitted imperfectly. |
| GDP deflator is a fixed-basket retail CPI | It measures price change associated with domestic output. |
| CPI base remains 2012 and WPI base remains 2011–12 forever | Both official series were revised in 2026. |
| Nominal deposit returns are real returns | Inflation and taxes affect purchasing power. |
Worked examples
A — Index change: CPI 125 last year; 132.5 now → YoY inflation = 6%.
B — Disinflation: price index 100 → 110 → 115.5: annual inflation slows from 10% to 5%; the price level does not fall.
C — Real wage: nominal wages rise 8%; CPI rises 6% → approximate real wage growth 2%; exact (1.08/1.06)−1 = 1.89%.
D — GDP deflator: nominal GDP 2,400; real GDP 2,000 → deflator 120.
E — Weighted illustration: food weight 40%, food prices +8%; other prices +2% → simplified weighted inflation = 4.4%.
Quick check — BA-16-02
- Who publishes India's CPI? NSO/MoSPI.
- Who publishes WPI? Office of Economic Adviser, DPIIT.
- What is disinflation? A slowing rate of price increase.
- Does a CPI index of 130 imply annual inflation is 30%? Not without the relevant comparison index.
- Can nominal income rise while real income falls? Yes.
- Why do oil prices matter to India's inflation? Imported energy prices can affect costs and household prices.
Lesson recap: Inflation is a rate of change in the general price level. CPI, WPI and the GDP deflator measure different price concepts. Both the cause of inflation and the reference period used to measure it matter for banking decisions.